Sensors are an integral part of horticulture research and generate new knowledge on orchard management from the analysis of large volumes of data.
On this page:
- Introduction
- The Cartographer in detail
- Precise monitoring of plant water status to detect drought stress
- Project acknowledgement
Introduction
Horticulture researchers from Agriculture Victoria Research (AVR) have been testing light detection and ranging (LiDAR) sensors for several applications in stone and pome fruit crops e.g., in situ fruit location in tree canopies and canopy light interception using a solar position model combined with spatial location of leaves and wood.
More recently, a Cartographer™ (mobile sensorised platform) equipped with high-resolution imaging sensors, 3D LiDAR, GPS and infrared temperature sensors has been commissioned at the Tatura SmartFarm. Powerful machine learning (ML) algorithms are used to analyse significantly high volumes of data from the LiDAR instrument on this mobile platform to provide measures of tree height canopy density and structure. The researchers will be expanding this to estimate canopy light interception, trunk diameter and annual tree growth.
The Cartographer in detail
The team of AVR spatial, plant and computer scientists are focusing on innovative techniques to integrate, manage and analyse this upsurge of AgTech-Big data efficiently to advance horticultural outcomes.
The Green Atlas cartographer:
- a sensorized platform
- LiDAR sensor
- Optical cameras and strobe lights
- Data logger
- captures data on tree geometry
- estimates yield prior to harvest
- fruit quality and fruit maturity determination
Video: Dr Ian Goodwin, Tatura SmartFarm at Agriculture Victoria, talks about the Green Atlas Cartographer.
Grower views
Video: Interviews with Stonefruit producers Adrian Conti (Conti Orchards, Cobram) & Rocky Varapodio (Pomona Valley Orchards, Ardmona) on the Green Atlas Cartographer
Green Atlas Cartographer - presentation from the developers
Video: The Green Atlas Cartographer - Dr Steve Scheding, developer from Green Atlas
Summerfruit Webinar Series 2021
Presentation by Dr Steve Scheding about the Green Atlas mobile platform to map fruit number, fruit size, fruit colour and canopy size. Part of the Food Agility CRC project: Deploying real-time sensors to meet Summerfruit export requirements.
Resources:
Example Data Sets - see what the Green Atlas Cartographer is capable of in a variety of crop types and to experience a live demonstration of the web-based Green Atlas visualisation tool
Video Transcript: Green Atlas Cartographer mobile platform Dr Steve Scheding presentation 2021
I am Steve Scheding. I'm one of the co-founders of Green Atlas. And today I'd like to talk to you about the work we've been doing with the CRC food agility and Agriculture Victoria in developing our services specifically for the stone fruit industry.
So our mission is green Atlas is to assist growers to optimize and manage the lifecycle of every fruit on every tree using cutting edge technology. It's very easy to think about how you might optimize performance of a single tree, but when you scale it up to the size of an entire orchard, it's an enormous problem. It's not uncommon to have millions of trees under management, across diverse geographies and occasionally hemispheres. Green Atlas has chosen to apply our years of experience in machine learning and AI in horticulture to identify and classify all of the flowers and fruits in an orchard at all stages of the fruit life cycle. In post harvest, the information can be critical for the purposes of things like orchard sanitation. With trace specific data, proactive automation and precision orchard management can be applied using the knowledge of the performance of every tree. This then enables more efficient management of trees to target and yeild prediction or minimizing costs and maximizing sustainable production.
Today, typically to manage all of the fruit on all of these trees, growers currently on a collected tiny amount of data and almost all of that by hand, extrapolating what was measured to the rest of the orchard. The underlying assumption is that the sample trees are representative of the orchard as a whole. However, as you'll see during this presentation, it's very rarely the case.
Our cartographer, which is our primary product and service ,is a ground-based system that collects data on each and every tree, at a speed that's unparalleled in the industry and thousands of times faster than performing the same task by hand. There's a saying you can't manage what you can't measure, and we created the cartographer to be the most powerful measurement device for the thing that growers care about the most, what is on my trees. If we all do our jobs right at the end of the season, we've measured in the system, the optimization of the fruit bearing potential of every single tree. So we're really trying to make every single one of these trees, a Goldilocks tree, just right.
We're committed to providing growers with the best possible tools to help improve both the top line and the bottom line of their businesses. We're already working with growers around the world to improve quality yields, provide forecasts for more precise marketing and to assist with placing labour inputs exactly where they needed, and nowhere else. The cartographer operates with a single button press. You just turn it on, log data, drive at a fairly constant speed, no complex instructions necessary.
As it's driven, it's gathering up to 10 high resolution images and 300,000 LiDAR arrange points per second. The data is processed in a custom data processing solution with short turnarounds, usually overnight, and can be made available in a number of farm relevant forms. It's also engineered to be highly reconfigurable, making it suitable for many crops over a dozen now and counting. Our partners in fact, often reconfigure the cartographer on the fly, servicing many crops with a single platform. As I mentioned, it's fast too, and it works day or night. The cartographer provides extremely consistent results in a wide variety of external conditions. This video is a compilation of footage from a number of different crops during normal customer operation, as a matter of routine. We're fast enough to easily work in and around other farming operations, making the deployment very simple.
So the work that we've been doing with the CRC food agility is really summarized in this slide. So we've been working with Agriculture Victoria in particular to validate the performance of the cartographer system. So the kinds of things that we're trying to to validate how accurate are the size estimates that we get from cartographer - fruit size, how accurate are color estimates. And you can see the way the experiment has been set up in this slide with a cartographer on the right-hand panel. And you can see in the left and the central panels that we've established a certain sentinel zones, which have fruit and in the panel on the left things like tennis balls of known size and known colour, the gray reference colour is there so that we can calibrate our color reference. So this is an example of using the cartographer to measure size. Along the left-hand axis we have the measurements that the cartographer is making all those Sentinel fruits. And on the bottom axis, we have the ground truth, which has been measured by Ag Vic using the caliper as you can see on the left. And what we're seeing in this graph is that the comparison between ground truth and cartographer measurements is in fact very good and this gives us very high confidence that when we are driving through the orchard at speed that we will be able to provide a fruit size distributions of high accuracy, but of thousands and thousands of pieces of fruit prior to prior to harvest. And certainly at different points if desired.
So the previous graph was all the fruit that we measured across a number of stone fruit. In this graph prepared by Alessio at Ag Vic is then broken it down by a number of different metrics. So for example, by variety and training in these particular examples, but we've also looked at- is it independent of the height in the canopy and a number of different metrics? And what we're finding is that by and large, we're still getting these extremely good results regardless of the type of fruit, regardless of the training system that's been used and regardless of the crop that we are measuring.
So this gives us a very good confidence that that we're getting very accurate result. Similarly for color, we've done comparisons between colour measured by the cartographer in these calibrations zones versus spectrometer measurements. And again, particularly up in the top right-hand quadrant here, we're getting quite good comparisons between cartographer measured fruit color, which is a good estimate in some fruits of fruit maturity. Tracking it over time allows us to understand when is potentially the best time to harvest certain fruits. So we're getting very good, good comparisons. There's a difference in that we are using our own illumination and natural illumination, so there's a bit more variability here than in the size measurements, but we think it's sufficient to to make a good call about when to harvest in particular.
This is what it looks like at scale. So as we go through an orchard and we drive up and down the rows, we're measuring all the fruit on the trees, which you can see on the panel on the right here, at each location we're then getting an average colour, essentially the most likely colour in a particular location, and we can plot that on a map. And you see here, there's a a plum block and a nectar and block, and we're certainly getting more of the purple-y color in the plum block and more of the Reddy color in the nectarines. If you take multiple scans over time, you can overlay them on these in this visualization and you can actually see the colour progression over time.
So the cartographer system can scan and produce heat maps of flower fruitlet, fruit, and geometric variability completely automatically with a fast turnaround. Many of our growers use the cartographer heat maps as a timely method to plan that precision orchard management those activities. When accurate counts are needed, as in forward yield estimation, we apply calibration to the data. This involves gathering hand count data as ground truth to assist in estimating the ratio of visible to hidden fruit, as well as a number of other factors that can be bundled into this calibration.
The graph on this slide shows a calibration graph for, in this case, it's an apple log. Once we've applied the calibration, we can view the data in our maps as counts per tree, counts per meter, counts per Hectare, or even counts per block, depending on the grower preference. This is what it looks like in stone fruit. So here we've taken a block of a commercial orchard of plums. We've scanned the entire block and we've calibrated it using a number of zones. You can see the calibration graph on the left. So we've done hand counts in six zones, and we've compared the counts per image that we get in the cartographer to the counts on the ground. And then we apply that calibration to all of our data, which you can see in the map on the right. One of the interesting things that we point out here. This is a well-managed block, but the variability is still extremely high. If you look at the yellow colors in this map, that's where the fruit count is zero to 90 per tree. If you look at the dark blue dots on the map, we're counting 300 plus fruit per tree in the same block. So the variability is extremely high. If you have a look at the panel in the middle, these are the kinds of calibrated numbers that we come up with. So in this case on average, we're getting 193 fruit per tree. 102 of those were in the upper canopy. So from 50% tree height and above 92 of those were in the lower canopy. And we can break into as many vertical zones as necessary. There are metrics there for the geometric measures, so on average, these trees were almost four meters tall, had about five and a half meters squared canopy area and a canopy density of 0.56, which is a unit between zero and one.
Then we move into the counts per blocks, so number of fruit per block and a count per Hectare.
So we also do canopy geometry measures, and I'm just showing an example here from apples. It's not stone fruit. We do this to assist with things like spraying and pruning. So we're providing several geometric measures. In this particular case, we're showing canopy cross-sectional area across an entire apple block or a number of blocks. You can immediately see that it varies quite significantly across these blocks. With several yellowish areas, which are low canopy volume and a few areas of dark blue, which are very high canopy volume. We also provide measures of the canopy height and a metric of canopy density , as you've seen on the previous slide.
Here's an example where I've actually used that for pruning. In this example, we've used the canopy cross-sectional area to show the effectiveness of the pruning operation. The data was processed into zones, on the left. That gives an indication of how much pruning is going to be needed to bring the block to uniformity. Green indicates high canopy volume. After pruning, the block was scanned again, producing the image on the right. It's much more uniform now, but there is still room for improvement.
One of the other things that we're tying at data to, and in fact, we're doing trials right at the moment, is dividing our blocks into regions that can be either handed the staff in the field for manual operations like fruitlet thinning, or they can be directly connected to a fairly new breed of variable rate technology, such as spray or spreader controllers for precision management of of orchard inputs.
We're working with a number of equipment control providers to ensure there's good integration between our systems and their systems. Principally we're focused on controllers that can be retrofitted to standard existing equipment, such as the blast sprayers that are commonly used in orchards. We're , as I mentioned, we're undertaking number of trials at the moment with our partners and customers in order to ensure both the safety and the effectiveness of variable rate spray in particular, and particularly around thinning operations in flowers and early fruitless onset.
So there's a number of key benefits to implementing variable rate application technology, which I've listed here. Ultimately there's the potential to save thousands of dollars per Ha, depending on the variability of the block. The more variability that was present at the beginning, the more savings potential there is.
So our mission, as I mentioned, is to assist you in managing the lifecycle of your fruit on every tree, in your orchard.
Thanks for your attention. Please feel free to reach out to me on this email address. If you'd like to discuss anything further.
Precise monitoring of plant water status to detect drought stress
Research: Cartographer used to rapidly measure and map nectarine orchard canopy thermal indices, at Tatura SmartFarm. Precision irrigation will be paramount in situations of water scarcity and climate change.
Read more - ground based mobile platform to measure and map canopy thermal indices
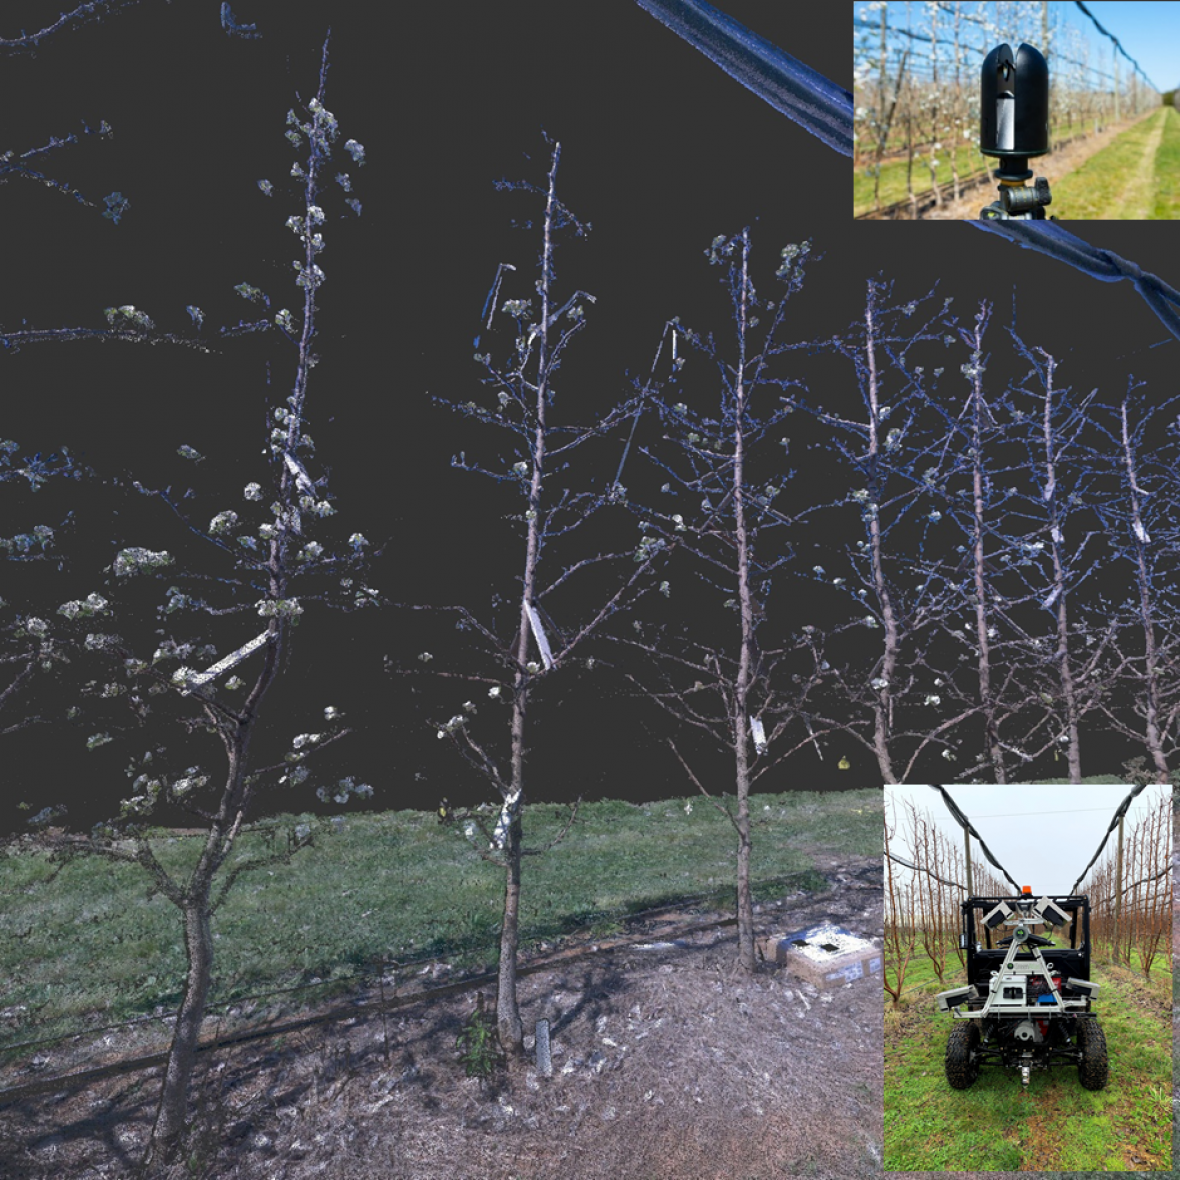 Top right: LiDAR sensor. Centre: Image replication from LiDAR. Bottom right: Mobile LiDAR sensing plaform
Acknowledgement
This study was financially supported by the project ‘Deploying real-time sensors to meet Summerfruit export requirements’ funded by Food Agility CRC Ltd., under the Commonwealth Government CRC Program with co-investment from Agriculture Victoria and Summerfruit Australia Limited. The CRC Program supports industry-led collaborations between industry, researchers and the community.