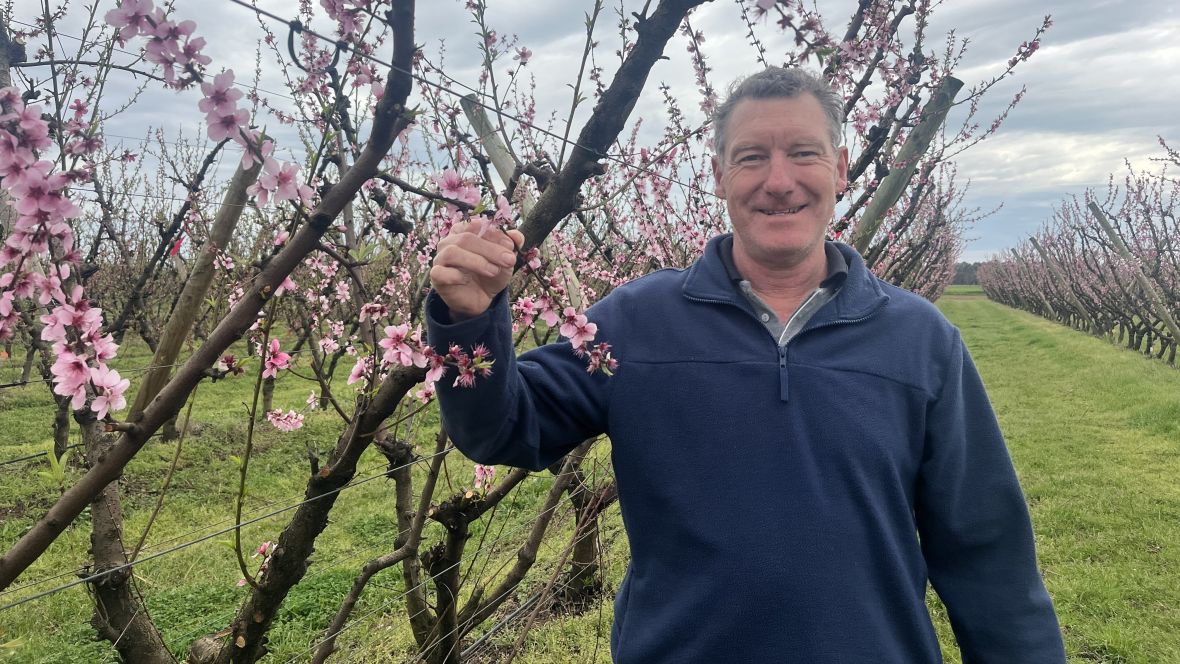
Dr Mark O'Connell in the Stonefruit Research Orchard at Agriculture Victoria's Tatura SmartFarm
Dr Mark O'Connell is an Agriculture Victoria researcher focused on improving the profitability, efficiency and sustainability of Australia’s summerfruit industry.
This project is developing profitable management strategies for summerfruit growers associated with temporal and spatial variation in crop load, fruit quality (fruit number per tree, fruit size and colour), and labour use efficiency.
Through trials at the Tatura SmartFarm, this project demonstrates the value of precision crop information and data-driven spatial ‘zonal’ crop load management (chemical, mechanical and hand thinning) geared to tree size to provide fruit growers with objective data for decision-making.
Scans of commercial orchard blocks provide ‘real world’ examples of spatial data on crop load, fruit size, fruit colour, yield and tree vigour and size.
AgTech trialled for measurements in the orchard:
a ground based cartographer for scanning tree size, fruit size, fruit number and blossom loads,
hand held smartphone apps to measure fruit size and fruit number,
airbourne drone system to measure fruit number, fruit size, tree size and blossom loads.
Precision Agriculture on crop load trials:
Crop load trials are occurring on apricot, plum, nectarine, and peach comparing:
the Darwin string mechanical thinner
manual fruitlet thinning
precision pruning and hedging
chemical flower thinning
Factsheet[PDF File] Smart Sensing Technologies for Precision Crop Load Management in Australian Summerfruit Orchards
Table 1 outlines the experimental crop load (blossom and fruitlet thinning) treatments under a Tatura Trellis canopy system for apricot ‘Golden May’ in season 2024/25 at Tatura, Victoria, Australia.
Table 2 presents production results (yield, fruit quality) for apricot ‘Golden May’ in response to crop load treatments for season 2024/25.
In summary, the early season apricot ‘Golden May’ produced medium sized (≈ 30 g) fruit and yielded 6.3 kg/tree when grown under a medium crop load (hand thinned treatment) regime. The 0.5_ATS+Darwin treatment resulted in the lowest crop load, whereby low final fruit number increased fruit weight and fruit diameter, increased yield, and no effect on fruit skin colour (CDI 0.65). The Darwin treatment alone improved fruit colour (CDI 0.68).
Table 1. Crop load (blossom and fruitlet thinning) treatments under a Tatura Trellis canopy system for apricot ‘Golden May’ in season 2024/25 at Tatura, Victoria, Australia.
Table 2. Yield and fruit quality performance statistics in response to crop load treatments of apricot ‘Golden May’ under a Tatura Trellis canopy system during 2024/25 season.
Treatment
Fruit number (#/tree)
Yield (kg)
Fruit weight (g)
Fruit diameter (mm)
Fruit colour (CDI)
ATS_0.5
396 c
9.9 a
25.0 a
40.4 a
0.63 ab
ATS_0.5+Darwin
222 a
8.0 b
36.2 b
44.0 b
0.65 abc
ATS_1
385 c
9.4 a
24.5 a
40.3 a
0.63 a
ATS_1+Darwin
303 abc
7.8 a
25.6 a
40.6 a
0.66 abc
ATS_1.5
371 c
9.3 a
25.0 a
40.4 a
0.63 ab
ATS_1.5+Darwin
249 ab
7.1 a
28.4 a
41.5 a
0.66 bc
Unthinned
335 bc
8.8 a
26.8 a
41.0 a
0.63 ab
Darwin
307 abc
9.5 ab
31.4 ab
42.5 ab
0.68 c
Hand
214 a
6.3 ab
29.6 ab
41.9 ab
0.65 abc
ANOVA
***
***
***
***
***
nd, ns, *, ** and *** indicate not determined, non-significant or significant differences at P < 0.05, 0.01 or 0.001, respectively. CDI denotes colour development index (scale: 0 – 1). Different letters within a group suggest that those data are significantly different from each other.
Table 3 outlines the experimental crop load (blossom and fruitlet thinning) treatments under a vase canopy system for nectarine ‘Rose Bright’ in season 2024/25 at Tatura, Victoria, Australia.
Table 4 presents production results (yield, fruit quality) for nectarine ‘Rose Bright’ in response to crop load treatments for season 2024/25.
In summary, the early season nectarine ‘Rose Bright’ produced medium sized (≈ 70 g) fruit and yielded 20 kg/tree when grown under a medium crop load (hand thinned treatment) regime. The ATS_1.5 treatment resulted in a crop load similar to hand thinning, whereas lower rates of ATS fail to reduce fruit number per tree. Hand thinning reduced fruit skin colour (CDI 0.83) compared to other treatments.
Table 3. Crop load (blossom and fruitlet thinning) treatments under a vase canopy system for nectarine ‘Rose Bright’ in season 2024/25 at Tatura, Victoria, Australia.
Table 4. Yield and fruit quality performance statistics in response to crop load treatments of nectarine ‘Rose Bright’ under a vase canopy system during 2024/25 season.
Treatment
Fruit number (#/tree)
Yield (kg)
Fruit weight (g)
Fruit diameter (mm)
Fruit colour (CDI)
ATS_0.5
473 ab
24.2
78.7
46.6
0.87 b
ATS_1.0
445 ab
23.8
73.7
47.5
0.87 b
ATS_1.5
380 a
20.0
55.5
47.5
0.87 b
Unthinned
506 b
25.4
51.4
46.3
0.87 b
Hand
370 ab
20.0
77.5
46.8
0.83 a
ANOVA
*
ns
ns
ns
***
nd, ns, *, ** and *** indicate not determined, non-significant or significant differences at P < 0.05, 0.01 or 0.001, respectively. CDI denotes colour development index (scale: 0 – 1). Different letters within a group suggest that those data are significantly different from each other.
Tables 5 and 6 outline the experimental crop load (blossom and fruitlet thinning) treatments under a Tatura Trellis and Vertical Leader canopy system, respectively, for peach ‘August Flame’ in season 2024/25 at Tatura, Victoria, Australia.
Tables 7 and 8 presents production results (yield, fruit quality) for peach ‘August Flame’ in response to crop load treatments for season 2024/25 under a Tatura Trellis and Vertical Leader canopy system, respectively.
In summary, the midseason peach ‘August Flame’ produced medium sized (74 - 81 g) fruit and yielded 6.5 and 12.0 kg/tree when grown under a medium crop load (hand thinned treatment) regime, under Vertical Leader and Tatura Trellis systems, respectively. Combinations of Darwin thinning treatments resulted in the lowest crop loads, whereby low final fruit number increased fruit weight and fruit diameter at the expense of yield. The ACC treatment did not reduce fruit number compared to the unthinned treatment. All crop load (blossom and fruitlet thinning) treatments had no effect on fruit skin colour (CDI ≈ 0.75).
Table 5. Crop load (blossom and fruitlet thinning) treatments under a Tatura Trellis canopy system for peach ‘August Flame’ in season 2024/25 at Tatura, Victoria, Australia.
Treatment
Rate (% v/v)
Timing (% bloom)
Method
ATS_0.5
0.5
100
Sprayer
ATS_1.0
1.0
100
Sprayer
ATS_1.5
1.5
100
Sprayer
ACC
350 ppm
100
Backpack
Darwin
-
100
Mechanical
Unthinned
-
100
-
Hand
-
Fruitlet
Manual
Plant growth regulators; ATS (Ammonium Thiosulphate) and ACC (Accede).
Table 6. Crop load (blossom and fruitlet thinning) treatments under a Vertical Leader canopy system for peach ‘August Flame’ in season 2024/25 at Tatura, Victoria, Australia.
Treatment
Rate (% v/v)
Timing (% bloom)
Method
ATS_0.5
0.5
100
Sprayer
ATS_1.0
1.0
100
Sprayer
ATS_1.5
1.5
100
Sprayer
ACC
350 ppm
100
Backpack
Darwin
-
100
Mechanical
Unthinned
-
100
-
Hedge
-
Midseason
Mechanical
Hand
-
Fruitlet
Manual
Plant growth regulators; ATS (Ammonium Thiosulphate) and ACC (Accede).
Table 7. Yield and fruit quality performance statistics in response to crop load treatments of peach ‘August Flame’ under a Tatura Trellis canopy system during 2024/25 season.
Treatment
Fruit number (#/tree)
Yield (kg)
Fruit weight (g)
Fruit diameter (mm)
Fruit colour (CDI)
ATS_0.5
181 b
13.7 c
76.1 ab
53.4 ab
0.76
ATS_0.5+Darwin
82 a
7.4 ab
90.5 b
56.3 b
0.76
ATS_1
172 b
11.8 bc
68.7 ab
51.8 ab
0.74
ATS_1+Darwin
81 a
7.6 ab
93.8 b
57.0 b
0.71
ATS_1.5
192 b
12.0 bc
62.5 a
50.5 a
0.74
ATS_1.5+Darwin
82 a
7.6 ab
92.9 b
56.8 b
0.72
ACC
165 b
12.0abc
73.2 ab
52.8 ab
0.82
Unthinned
169 b
12.0 bc
70.7 ab
52.27 ab
0.78
Darwin
76 a
6.1 a
80.6 ab
54.3 ab
0.78
Hand
146 b
12.0 bc
80.9 ab
54.4 ab
0.72
ANOVA
***
***
**
**
ns
nd, ns, *, ** and *** indicate not determined, non-significant or significant differences at P < 0.05, 0.01 or 0.001, respectively. CDI denotes colour development index (scale: 0 – 1). Different letters within a group suggest that those data are significantly different from each other.
Table 8. Yield and fruit quality performance statistics in response to crop load treatments of peach ‘August Flame’ under a Vertical Leader canopy system during 2024/25 season.
Treatment
Fruit number (#/tree)
Yield (kg)
Fruit weight (g)
Fruit diameter (mm)
Fruit colour (CDI)
ATS_0.5
85 c
5.4 c
63.7 ab
50.8 ab
0.78
ATS_0.5+Darwin
18 a
1.7 a
95.9 d
57.5 d
0.78
ATS_0.5+Hedge
89 c
5.8 c
65.5 abc
51.2 abc
0.77
ATS_1
86 c
4.8 c
55.9 a
49.2 a
0.76
ATS_1+Darwin
18 ab
1.4 a
78.6 bcd
53.9 bcd
0.77
ATS_1.5
98 c
5.6 c
56.6 ab
49.3 ab
0.75
ATS_1.5+Darwin
22 ab
1.6 a
76.9 abcd
53.5 abcd
0.73
ATS_1.5+Hedge
75 bc
5.0 abc
65.6 abc
51.2 abc
0.76
ACC
84 c
5.3 bc
63.8 ab
50.8 ab
0.76
Unthinned
88 c
5.5 c
61.6 ab
50.4 ab
0.76
Darwin
19 ab
1.8 ab
90.7 cd
56.3 cd
0.80
Hand
90 c
6.5 c
74.0 abcd
52.9 abcd
0.76
ANOVA
***
***
***
***
ns
nd, ns, *, ** and *** indicate not determined, non-significant or significant differences at P < 0.05, 0.01 or 0.001, respectively. CDI denotes colour development index (scale: 0 – 1). Different letters within a group suggest that those data are significantly different from each other.
Tables 9 and 10 outline the experimental crop load (blossom and fruitlet thinning) treatments under a Tatura Trellis and Vertical Leader canopy system, respectively, for nectarine ‘Autumn Bright’ in season 2024/25 at Tatura, Victoria, Australia.
Tables 11 and 12 presents production results (yield, fruit quality) for nectarine ‘Autumn Bright’ in response to crop load treatments for season 2024/25 under a Tatura Trellis and Vertical Leader canopy system, respectively.
In summary, the midseason nectarine ‘Autumn Bright’ produced medium sized (70 - 77 g) fruit and yielded 6.2 and 12.5 kg/tree under a Vertical Leader and Tatura Trellis system, respectively, when grown under a medium crop load (hand thinned treatment) regime. For the Vertical Leader system, combinations of ATS, ACC and/or Darwin thinning treatments resulted in lower crop loads, whereby low final fruit number increased fruit weight and fruit diameter at the expense of yield (Table 12). Whereas, on Tatura Trellis system the crop load (blossom and fruitlet thinning) treatments resulted in minimal differences in fruit quality outcomes (Table 11).
Table 9. Crop load (blossom and fruitlet thinning) treatments under a Tatura Trellis canopy system for nectarine ‘Autumn Bright’ in season 2024/25 at Tatura, Victoria, Australia.
Treatment
Rate (% v/v)
Timing (% bloom)
Method
ATS_0.5
0.5
100
Sprayer
ATS_1.0
1.0
100
Sprayer
ATS_1.5
1.5
100
Sprayer
ACC
350 ppm
100
Backpack
Darwin
-
100
Mechanical
Unthinned
-
100
-
Hand
-
Fruitlet
Manual
Plant growth regulators; ATS (Ammonium Thiosulphate) and ACC (Accede).
Table 10. Crop load (blossom and fruitlet thinning) treatments under a Vertical Leader canopy system for nectarine ‘Autumn Bright’ in season 2024/25 at Tatura, Victoria, Australia.
Treatment
Rate (% v/v)
Timing (% bloom)
Method
ATS_0.5
0.5
100
Sprayer
ATS_1.0
1.0
100
Sprayer
ATS_1.5
1.5
100
Sprayer
ACC
350 ppm
100
Backpack
Darwin
-
100
Mechanical
Unthinned
-
100
-
Hedge
-
Midseason
Mechanical
Hand
-
Fruitlet
Manual
Plant growth regulators; ATS (Ammonium Thiosulphate) and ACC (Accede).
Table 11. Yield and fruit quality performance statistics in response to crop load treatments of nectarine ‘Autumn Bright’ under a Tatura Trellis canopy system during 2024/25 season.
Treatment
Fruit number (#/tree)
Yield (kg)
Fruit weight (g)
Fruit diameter (mm)
Fruit colour (CDI)
ATS_0.5
197
11.6
59.4 abc
49.9 abc
0.81
ATS_0.5+Darwin
174
14.1
81.3 d
55.2 d
0.82
ATS_1
196
10.6
54.7 a
48.8 a
0.83
ATS_1+Darwin
174
12.3
70.8abcd
52.6abcd
0.83
ATS_1.5
198
11.6
60.0 abc
50.1 abc
0.83
ATS_1.5+Darwin
149
10.5
70.3abcd
52.5 abcd
0.83
ACC
232
12.2
52.6 ab
48.3 ab
0.82
Unthinned
189
11.1
59.2 abc
49.9 abc
0.83
Darwin
139
10.4
74.7 cd
53.6 cd
0.81
Hand
179
12.5
70.3 bcd
52.5 bcd
0.82
ANOVA
ns
ns
***
***
ns
nd, ns, *, ** and *** indicate not determined, non-significant or significant differences at P < 0.05, 0.01 or 0.001, respectively. CDI denotes colour development index (scale: 0 – 1). Different letters within a group suggest that those data are significantly different from each other.
Table 12. Yield and fruit quality performance statistics in response to crop load treatments of nectarine ‘Autumn Bright’ under a Vertical Leader canopy system during 2024/25 season.
Treatment
Fruit number (#/tree)
Yield (kg)
Fruit weight (g)
Fruit diameter (mm)
Fruit colour (CDI)
ATS_0.5
108 c
7.1 bc
66.2 ab
51.6 ab
0.85 bc
ATS_0.5+Darwin+Hedge
50 ab
4.1ab
81.8 def
55.3 def
0.83 ab
ATS_0.5+Hedge
104 bcd
7.1abc
68.2 abcd
52.0 abcd
0.85 abc
ATS_1
101 c
7.1 bc
69.8 abc
52.4 abc
0.85 bc
ATS_1+Darwin+Hedge
45 ab
3.7ab
84.2 ef
55.9 ef
0.83 ab
ATS_1.5
106 c
7.2bc
68.8 abcd
52.2 abcd
0.86 bc
ATS_1.5+Darwin+Hedge
33 a
3.1 a
94.8 f
58.4 f
0.81 a
ATS_1.5+Hedge
96 bc
6.9abc
71.8abcde
52.9 abcde
0.86 bc
ACC
82 abc
5.8ab
71.4 abcd
52.8 abcd
0.85 bc
Unthinned
163 d
10.1 c
62.5 a
50.7 a
0.87 c
Darwin
55 abc
4.4ab
81.0 cde
55.1 cde
0.83 ab
Hand
80 abc
6.2ab
77.3 bcde
54.2 bcde
0.86 bc
ANOVA
***
***
***
***
***
nd, ns, *, ** and *** indicate not determined, non-significant or significant differences at P < 0.05, 0.01 or 0.001, respectively. CDI denotes colour development index (scale: 0 – 1). Different letters within a group suggest that those data are significantly different from each other.
Table 13 outlines the experimental crop load (blossom and fruitlet thinning) treatments under a Tatura Trellis canopy system for plum ‘Angeleno’ in season 2024/25 at Tatura, Victoria, Australia.
Table 14 presents production results (yield, fruit quality) for plum ‘Angeleno’ in response to crop load treatments for season 2024/25.
In summary, the late season plum ‘Angeleno’ produced medium sized (≈ 43 g) fruit and yielded 7.9 kg/tree when grown under a medium crop load (hand thinned treatment) regime. Combinations of ATS and/or Darwin thinning treatments resulted in the lowest crop loads, whereby low final fruit number increased fruit weight and fruit diameter at the expense of yield. The ACC treatment did not reduce fruit number compared to the unthinned treatment. All crop load (blossom and fruitlet thinning) treatments had no effect on fruit skin colour (CDI ≈ 0.82).
Table 13. Crop load (blossom and fruitlet thinning) treatments under a Tatura Trellis canopy system for plum ‘Angeleno’ in season 2024/25 at Tatura, Victoria, Australia.
Treatment
Rate (% v/v)
Timing (% bloom)
Method
ATS_0.5
0.5
100
Sprayer
ATS_1.0
1.0
100
Sprayer
ATS_1.5
1.5
100
Sprayer
ACC
350 ppm
100
Backpack
Darwin
-
100
Mechanical
Unthinned
-
100
-
Hand
-
Fruitlet
Manual
Plant growth regulators; ATS (Ammonium Thiosulphate) and ACC (Accede).
Table 14. Yield and fruit quality performance statistics in response to crop load treatments of plum ‘Angeleno’ under a Tatura Trellis canopy system during 2024/25 season.
Treatment
Fruit number (#/tree)
Yield (kg)
Fruit weight (g)
Fruit diameter (mm)
Fruit colour (CDI)
ATS_0.5
225 de
9.7 de
43.3 a
40.6 a
0.82
ATS_0.5+Darwin
106 ab
4.60 ab
43.6 abc
41.5 abc
0.83
ATS_1
181 cd
7.9 cd
43.6 abc
41.7 abc
0.81
ATS_1+Darwin
71 a
3.1 a
43.9 bc
42.9 bc
0.80
ATS_1.5
180 cd
7.9 cd
43.8 bc
42.5 bc
0.81
ATS_1.5+Darwin
77 a
3.4 a
44.0 c
43.5 c
0.81
ACC
271 e
11.8 e
43.5 abc
41.3 abc
0.83
Unthinned
264 e
11.4 e
43.1 a
39.6 a
0.85
Darwin
161 bc
7.0 bc
43.4 ab
40.9 ab
0.80
Hand
182 cd
7.9 cd
43.5 ab
41.1 ab
0.83
ANOVA
***
***
***
***
ns
nd, ns, *, ** and *** indicate not determined, non-significant or significant differences at P < 0.05, 0.01 or 0.001, respectively. CDI denotes colour development index (scale: 0 – 1).
Impact of chemical and mechanical blossom thinning on fruit number and quality in stone fruit.
Paper: The effects of chemical and mechanical blossom thinning on fruit number and quality in stone fruit. M. O’Connell, N. Valluri and A. Scalisi
This trial compared mechanical and chemical thinning with traditional manual thinning of blossoms or fruitlets across the 2024/25 and 2025/26 seasons in peach, nectarine, plum and apricot orchards at the Tatura SmartFarm.
Chemical thinning: ammonium thiosulphate (ATS) and 1-aminocyclopropane-1-carboxylic acid (ACC) applied at different rates
Mechanical thinning: Darwin string thinner at different thinning rates
Mechanical hedging
Results:
Chemical and mechanical blossom thinning can deliver fruit size, quality and yield comparable to traditional, labour-intensive manual fruitlet thinning.
Overall, the trial found that:
Larger final fruit size was associated with lower crop loads, achieved through hand thinning of fruitlets or higher rates of chemical and/or mechanical blossom thinning.
Mechanical and chemical blossom thinning delivered productivity benefits comparable to traditional hand thinning of fruitlets.
Fruit colour generally improved under lower crop loads.
Crop-specific observations:
Apricot ‘Golden May’
- Colour improved under the mechanical (Darwin_high) thinning treatment.
Peach ‘August Flame’
- No differences in fruit colour were detected across treatments.
Nectarine ‘Autumn Bright’
- Reduced fruit colour was observed in a trial using a combined chemical and mechanical treatment (ATS_high + Darwin_medium), likely due to delayed maturity caused by very low crop loads and larger fruit size.
Plum ‘Angeleno’ - Chemical thinning (ACC) reduced fruit colour and size in the second season.
Opportunities:
This work highlights opportunities for the Australian Summerfruit industry to adopt new technologies, precision agriculture principles and variable rate (spatial management) thinning to optimise fruit number and orchard productivity.
- Smart sensing technologies are available to help growers measure fruit number, fruit size, fruit colour and tree size.
- Combining precision orchard scans with variable-rate blossom thinning can improve fruit numbers per tree, helping business performance and profitability.
- Looking ahead, precision management and current smart tools can support advances in machine learning, mechanisation and robotics for orchard operations.
Video: Dr Mark O'Connell talks about blossom thinning in apricots in the Stonefruit Experimental Orchard at the Tatura SmartFarm (Autumn 2025)
Research in the orchard with Dr Mark O'Connell, Agriculture Victoria Tatura SmartFarm
Video transcript
Hello, it's Mark O'Connell from Ag Vic Tatura Smart Farm, and I'm standing in the Tatura Trellis experimental stone fruit orchard, and we're about to harvest our Golden May apricots. And what we've been doing this season is using AgTech and precision agriculture to set the crop load and measure the crop load and fruit size.
We have technologies like the ground base cartographer that scans the fruit and the trees. We have handheld apps that use the three camera systems and LiDAR systems and smart algorithms to determine fruit size, fruit number. And we're also testing, once we get it deployed, a airborne system using a drone to measure fruit number, fruit size, canopy size.
And what we've done this season, at the experimental stone fruit orchard, is use mechanical flower thinning with the Darwin thinner. We've used some chemical thinning systems, and we've used manual hand thinning, plus unthinned treatments. So, we're about to compare at harvest time, the final fruit size, final fruit number yield, and fruit distribution profiles of these different experimental treatments.
And now it's after harvest. We've had a chance to put that fruit over the fruit grader. We've also done orchard scans with the cartographer and produced heat maps of fruit size, fruit colour, fruit number, et cetera.
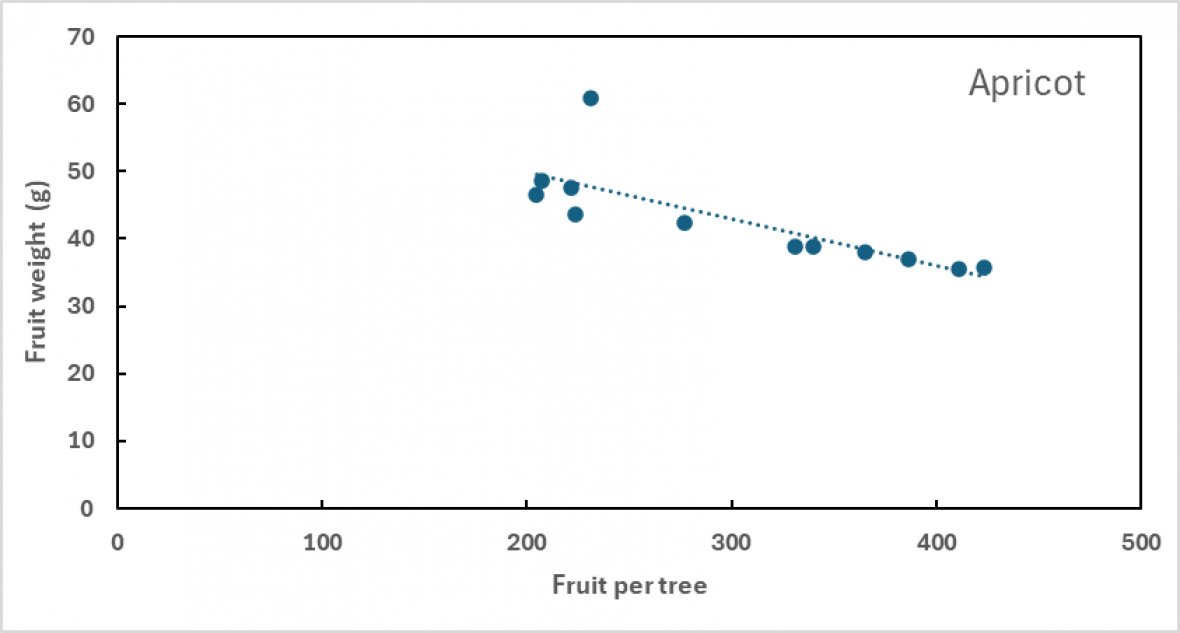
Looking at some of the data we can see we had a whole range of responses with fruit number per tree ranging from 200 fruit, a tree right through to 450 fruit per tree, and that induced a range of fruit sizes responses, and yield responses.
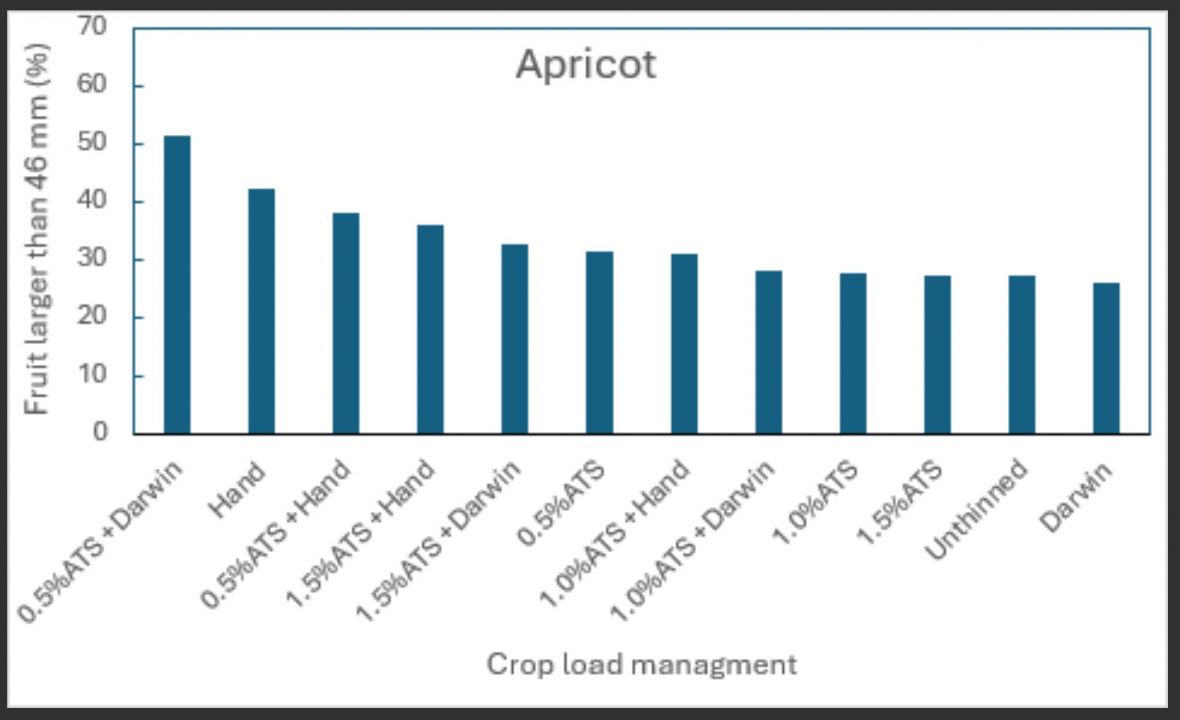
For example, the Darwin thin treatment plus plant growth regulator, ATS at a low rate, produced the least amount of fruit per tree, which responded in fruit size being larger at harvest, but at the penalty of a low yield.
Apricot blossom thinning case study
Blossom thinning using a combination of chemical thinners (ATS - a plant growth regulator) and mechanical thinner (Darwin string) increased final fruit size due to reduction in fruit number per tree.
Similarly, hand thinning at fruitlet stage produced a high proportion of large fruit (fruit diameter greater than 46 mm).
Chemical thinning alone (using ATS) at full bloom had minimal effect on final fruit number or fruit size in season 2024/25.
Proportion of large fruit size in response to crop load management using various blossom and fruitlet thinning techniques in apricot 'Golden May' on Tatura Trellis at the Tatura SmartFarm, season 2024/25
Fruit size and fruit yield in response to crop load management using various blossom and fruitlet thinning techniques in Apricot 'Golden May' on Tatura Trellis at the Tatura SmartFarm, season 2024/25
Acknowledgements
This project Precision summerfruit orchards (SF23000) has been funded by Hort Innovation, using the Summerfruit research and development levy, contributions from the Australian Government and co-investment from Agriculture Victoria. Hort Innovation is the grower-owned, not-for-profit research and development corporation for Australian horticulture.


 Precision orchards
 Dr Mark O'Connell in the Stonefruit Research Orchard at Agriculture Victoria's Tatura SmartFarm
 Proportion of large fruit size in response to crop load management using various blossom and fruitlet thinning techniques in apricot 'Golden May' on Tatura Trellis at the Tatura SmartFarm, season 2024/25
 Fruit size and fruit yield in response to crop load management using various blossom and fruitlet thinning techniques in Apricot 'Golden May' on Tatura Trellis at the Tatura SmartFarm, season 2024/25