


 Researchers & events
Stonefruit Research Roadshows are regional events for producers, highlighting research from the Stonefruit research orchard in Tatura and research from Agribiosciences, Bundoora. They are delivered by Agriculture Victoria, in partnership with Summerfruits Australia and local grower associations (Summerfruits SA, Swan Hill Summer Fruit Development Association, and Cobram & District Fruit Growers Association). Future roadshow events will be listed below. One national roadshow will be conducted.
2021 Summerfruit Research Webinar Series
- Industry update – Trevor Ranford, Summerfruit Australia CEO
Production research:
- Rootstocks on peach and nectarine. Results from SF17006 project, Experimental Stonefruit Orchard with Dr Mark O’Connell, Agriculture Victoria
Ag Tech research: Overview of the Ag Tech research projects, Dr Mark O’Connell, Agriculture Victoria
- Hand held sensor: measuring fruit quality and maturity, Dr Daniel Pelliccia, Rubens technologies
- Mobile platform to map fruit number, size, colour and canopy size, Dr Steve Scheding, Green Atlas
Video transcript: Webinar 1 Production and Ag Tech Research 25 Aug 2021
Welcome to the summer fruit industry webinar today, it's in replacement of the fact that we normally do a Stonefruit Research Roadshow and go to major growing regions around Victoria and in South Australia. I would just like to acknowledge the traditional owners of country throughout Victoria and recognize their continuing connection to land, water, and culture.
I pay my respects to the elders past present and emerging.
So we have two webinar events. So today there's a focus on production and ag tech research and just to highlight next week as well, there's some supply chain innovation research coming from a service supply chain project. And that's a fairly interesting one for export. So I suggest join us next week as well.
The industry funding is matched by the Victorian government, the Australian government, and your funds, horticulture innovation Australia.
Now our speakers for today. So we have Trevor Ranford who's our CEO for summer for Australia. He'll will provide us with some summer food industry updates.
We have Dr. Mark O'Connell from Agriculture, Victoria, and he'll be talking about results from the stonefruit project on rootstocks for peach and nectarine. Mark will also provide a brief overview of the Ag Tech research for the Food Agility CRC projects, that's been run at the Agriculture Victoria Smart Farm in Tatura.
Then we have Dr. Daniel Pelliccia from Ruben's Technologies and will be discussing the new handheld sensor. It's capable of measuring fruit maturity, fruit quality on fruit trees in the orchard.
And then we finish off with Dr. Steve Scheding from Green Atlas. He'll discuss the mobile platform that can map fruit number, size, color, and canopy size, providing producers with an enormous amount of information quickly to determine orchard needs to improve for quality and quantity outcomes.
So all presentations are being recorded and we made available on the HIN website, which I'll talk about that website at the end of the presentations. And the links will be provided from those presentations via the newsletters that you might've already seen, and we'll make our way to the main event.
And introduce Trevor Ranford our CEO from Summerfruit Australia
Good afternoon everybody. And thank you, mark for putting this event on. Apologies that it's not a physical roadshow, but that outside of our control at this point in time. I won't spend a lot of time, I think it's more important for you, for growers to hear the research work but, so I'll skip through some of this relatively quickly.
So Summerfruit Australia is the peak industry body for the stonefruit industry and it obviously manages the the levy process and those R & D funds that go into Hort Innovation match by Australian Government money. And. This project and a number of other projects are funded in that fashion.
The SAL board currently are those those people listed there. We will be having an annual general meeting coming up in the next few weeks and certainly Mick Young is retiring from the board and there will be some new names another new name that will go onto the board coming forward. From the point of view of a quick update, obviously communications involvement with R and D and marketing activities, market access ,market maintenance, managing the e-export registration then around your numerous projects, which I'll touch on near the end. We conducted an industry R and D showcase in May at Tatura which again we're restricted somewhat by the aspects of COVID . And more recently we have appointed a new trade development manager, a lady by the name of Olivia Tate, and she was about five weeks into that particular role. From a quick overview these triggers and the graphs come out of the Hort Innovation statistic handbook. So it gives you a idea of the moving trends, particularly within production and the overall value of the industry.
Again if people want more detail, they can access the statistical handbook from Hort Innovation, or they can contact me. From the point of view of exports, I think with 2018-19 was a record export year for the industry. Obviously we've gone through a cave and situations over the last two seasons effectively, but this year we were still able to export normally 21,000 tonnes. The dollar value of that $92 million and the unit value as estimated from the report prepared was a $4 39 kilo. And this was considered a record for the industry. China, even with the issues of COVID and the political uncertainties, was our lead market for nectarines, peaches and plums and the Middle East for apricots. And as you can see the split there, obviously from those figures, nectarines and plums certainly the major components of export. By state, Victoria is obviously stillthe larger state with 88 percent of production and export and across Victoria and New South Wales, the total of 96%. And the export s over a 10 year period has consistently increased even though it dipped somewhat in this last 12 months, mainly due to the impact of COVID and the lack of the airfreight availability. This is a graph that's part of a annual export report that's produced , and as you can see there 2018-19 was a record year. It dropped slightly 19-20 again because the aspects of COVID and other issues. And then a again a slight dip in the 2021, but still the last three years have been the best three years of export for the Australian Stonefruit industry. Even with a political unrest between Australia and China last year, 54% of production or export went to China, another right percent to Hong Kong, and one would believe some of that going into Hong Kong probably also went into China. So between Hong Kong and China, you're over 60% of exports. The challenge is how we maintain that and also grow the other export countries.
And that just gives you a another over view of each of the markets, and as you can see China and Hong Kong were up. We had a decline in some of the other smaller markets like Canada, Saudi Arabia and in the Indonesia but an increase in markets like India and the UAE, Singapore. So, again, we seeing growers going to specific markets, where from the point of view of market access it gives a, this table gives you a brief overview. I suppose the bottom line is there is that we still do not have a market access with Japan, New Zealand, South Korea, the U S and Vietnam. Our expectation is that Vietnam is very close. A lot of work's been done by the department and the industry. And unfortunately COVID hasn't allowed for travel either for us to travel to Vietnam or the Vietnamese authorities to travel here to Australia. So we're relient on people on the ground in Vietnam to to drive the process, and the United States, our belief is now that citrus has gained variations to their access that Stonefruit will go up the the pecking order in relation to the U S.
Some of the industry challenges, I'm not going to go into all of those, but what of labour, the aspects of labor were a problem last year, they will be an increasing problem this year. And people will have seen that. The government has announced an agricultural visa due to start the end of September. But whether that will get people in to Australia for this season will depend on the process.
Fruit fly has been a major issue. I'm in south Australia and it's been a major issue with outbreaks of Mediterranean fruit fly and Q fly as well. And certainly Victoria has suffered the with increased outbreaks.
Market access and market maintenances are high priority and continues to be that. And that's why Olivia Tate has been employed to give us those additional resources to work in that particular area.
Research development extension, so an important part of the industry and this webinar today is very much about R and D and the extension process that goes with it.
And freight, that's been one of our other major issues over the last 12 months, and we'll continue to be this year. The lack of aeroplanes coming into Australia and therefore limited planes going out, certainly there's been support by the Australian government with IFM has been an integral to that, but that's due to, at this point in time due to finish at the end of September, but we're hopeful that the government will extend that program, and we have issues with sea in available containers and available ships. 2020-21 was probably a perfect storm with all of the particular issues we were dealing with.
From the point of view of research and development, just covering off on a number of things. Obviously this project, this webinar is about the experimental Stonefruit orchard. We had a trade and market access project, which was completed. We've got a new one in place, and then there are a range of other projects listed there. Many of them are funded from additional sources outside of the Stonefruit levy, and I think that's been a valuable tool and again, the one in relation to the Food Agility of the both Daniel and Steve will talk on their components of of that particular project. So that'sa quick overview of where the industry's at. People want more information my details are there.
I'm Mark O'Connell based at Tatura Smart Farm in Victoria, and today I'll present some experimental findings on project SF17006, which is the experimental stone fruit orchard. And the topic of today will be the rootstocks from peach and nectarine. I acknowledge the Summerfruit industry fund throught Hort innovation.
Quick background: . We've just heard from Trevor that exports are increasing particularly Asia, middle east. We also know in the industry that the quality and the variability in fruit quality does impact our sales and consumer preferences. The industry has a whole diversity of orchard systems and canopy designs, everything from their low density, traditional vase type freestanding trees, right through to the modern high-density two dimensional. Trellis type orchards are coming into production at the moment and worldwide in terms of rootstocks breeding programs in stone fruit there's very few of those compared to other tree crops like apple, for example. In Australia and Nemiguard's the main industry standard rootstock, and that's particularly pertinent to peach and nectarine.
And overall in Australia, we have limited data on root stocks in stone fruit and information on tree survival at growth of development, et cetera, the yield, fruit number, fruit size components and the fruit quality aspects. So obviously rootstocks and the rootstock selection is a long-term strategy that needs to be decided before crop establishment. The vigour component of a rootstock is the, is a very important for orchard management at governs tree performance, it governs production, potential yield and fruit quality outcomes. And the main agronomic characteristics as we list there are tree survival and health of the tree, the vigor, the precocity, how early we can get into production, the adaptable to the soils, the climate, and to tolerance and resistance to stress, whether that's water stress, salinity, nematodes, pests, and diseases, et cetera.
Overall, the root stocks and systems provide important functions and they are access to water, nutrients, and barrier to soil stress, and a conduit for signals of plant growth and function. So what would expect to see if we have a dwarfing rootstock? What sort of behavior in the scion in the top of the part of the tree, this scion,? Less decreased growth, and that comes around through decreased crown or canopy size. It comes, that in trunk size, reduced shoot growth, reduced water shoots. It also changes in tree architecture, more greater branching angles. You can more shoots that are short and spurs. And we also have changes in the flowering and behavior there as well with increased flowering and fruit set. So there are currently a number of mechanisms and theories out there that explain this behavior in, in, in a tree reduced tree size. due to dwarfing rootstocks and the three or four main theories are carbon and or nutrient exchange, the hormonal metabolic signaling theory or the water relations theory. Worldwide, there is no consensus, not one consensus overall, in all the work that's been done around the world on apples and other tree crops as well. Quickly carbohydrate theory, the nutrition theory suggests that there's a reduced available of carbon and carbohydrates from the root system, and that reserves, it limits what happens in spring, and the main outcome is decreased growth, in the scion in the tree. This, the hormone signaling theory, similar sort of story produced everything relates to this reduced growth, but basically ABA and cytokidens and gibberellins synthesis, are all decreased, root growth's decreased, and that leads to changing tree behaviour, tree size.
The water relations theory is again, another one whether it's through the graph union or not, there's reduced water uptake and flux changes in what they call hydraulic conductance. Leads to mild water stress, changes the photo synthesis, and, or just see reduced tree growth. That's enough on the theory.
So our work at Tatura, it basically is looking at dwarf, semi-dwarf and vigorous rootstocks and looking at how they impact tree size. Have the rootstock affects yield of fruit quality and with an the hypothesis is that the reduced growth and changing the production percentage. So we've set up two carefully design field experiments, and when basically keeping everything else, constant water management, nutrition pest and disease management, soil type, everything else, except for the crop that we're growing. That's all the peach or nectarine and the rootstock treatment, which is the genetics. That's the overview of the experimental site Tatura and the two crops and cultivars are peaches and nectarines, the block of peach here, and the block of nectarine. On Shep fine Sandy loam, planted in 2013, a vase canopy, four leaders per canopy, two metre tree spacing, four and a half meter row spacing. And after the third leaf, we have been growing these trees and measuring things for the last five years. We've focused on the vegetation and yield fruit quality parameters.
So the focus is looking at these dwarf, semi-dwarf and or vigorous stocks on tree survivla, tree growth, tree development fruit yield and fruit quality. The root stocks are, Nemaguard, cornerstone Alberta, Krymsk 1, Krympsk 86 and Cadaman. Here's a snapshot of the trees in dormancy this winter. And you can see, as we, as I mentioned earlier, Nemaguard's to our control, our industry standard and we can see a tree size here and structure, and we can see a lot of suckers occurring on Krymsk 1 and also the reduced tree size.
So this is what we knew prior to the work. This is the evidence available at the time. Back in 2013, 2012, when the work for the study first started For Nemaguard, a very common vigorous root stock used in Sandy soils. Alberta typically use in heavier soils.Krymsk 86, another new rootstock considered vigorous, drought tolerance, high pH tolerance and wet soil potentially tolrant. Cadaman, new, another new rootstock alternative to GF677, prefers well-drained Sandy soils. Cornerstone, another new rootstock, high vigour, disease resistance in nematodes and crown gall. Krymsk 1, another new rootstock, cold and drought tolarant and water tolerant, water logging tolerant. So here's a a tree size graph, schematic and showing from zero to a hundred percent . And we are comparing ,we've got some here that, that we've captured in our Krymsk 86 Nemaguard and down here, Krymsk 1. So that suggests to me that Krymsk 1 should be dwarfing , And we should have high vigor in Krymsk 86 , Nemaguard, Cadaman. What we don't have information on is the cornerstone and Alberta.
Overall, what are we going to expect? We're gonna expect less vegetative growth in a dwarfing rootstock, reduced pruning biomass. That should occur. We would expect less internal shading that should lead to improve shoot quality and increase flower bud development.
Basic quick snapshot of some of our experimental designs and methods and approaches. And we're looking at phenology, light interception trunk size, for example, pruning, tree survival and health, yield and fruit quality. And as we're doing today, webinars and presentations. At harvest time, measuring fruit number, fruit weight and internal and external fruit quality parameters. We've got a in-line grader here with quick sensors.
We have published on the websites, on the HIN throughout the years, each each experimental treatment, each rootstock and a time series during the growth cycle each year. So there's a movie here, for example, on the nectarine.. And there's one on Peach available on the website. So what we found, well when we look at tree performance and when we look at fruit behavior, all the things we've measured, whether that's true survival, phenology, the pruning weights, tree size, light interception, branch diameter, the et cetera, shoot growth, that at harvest we're measuring leaf nitrogen, with the spag meter, for example, and suckering, and at harvest time, we measuring yield, fruit quality, everything we've measured with significant differences between rootstocks.
As an example, last season, 2020-21 in nectarine and in the peach, for the five root stocks under each crop, we're getting differences due to rootstock. So in, in nectarine, for example, we're getting reduced tree size, less light interception under the dwarfing rootstock Krymsk 1. We had no differences in other tree rootstock treatments for in the nectarine. Everything was similar to Nemaguard in this season. In that most current season in 2021 again we we measured light interception in the late season peach under the 5 different rootstocks. Compared the Nemaguard, we can see a slight reduction in tree size under Krymks 86.
What's been happening with pruning biomass over the last five winters and summers? So here's the cumulative pruning biomass that's winter and summer pruning for the first leaf, that's year three, year four, year five, year six, and year seven. For Rose Bright and for September Sun. And basically we're not getting much difference in pruning biomass, other than that, the dwafing rootstock having a large reduced amount of pruning material, being a smaller tree, in Krymsk 1. When we look at peach, with comparing Nemaguard, Elberta, Krymsk86, Cadaman, Cornerstone, over time, that looks to be a drop-off in the Krympsk 86 biomass pruning rate over time.
In terms of yield, what are we seeing? This is a cumulative yield, fresh weight kilograms per tree in seasons 3, 4, 5, 6, and seven on the nectarine and 3, 4, 5, 6, 7 on the peach for each root stock. Then as you can see there's an order here, and that's the same order we can see in the graph in the data. And we can see cornerstone is basically out yielding most rootstocks, especially compared to our industry standard, Nemaguard, and Krymsk 1 obviously being the smaller dwarfing trees had low yield outcomes. In peach, the late season peach, we got cornerstone again at the top of the rankings and very close second, third ranking for Cadaman and Nemaguard and Alberta, and then the least yielding crop and rootstock is the Krymsk 86 under peach.
What's happening to fruit quality, fruit wight, fruit sweetness? So this is a five-year summary for averages for Rosebright nectarine. Compared to Nemaguard and fruit weight is in blue. The blue bars. So compare to Nemaguard over a five-year period, the five years at the study so far, fruit size is increased under cornerstone on the Rose Bright trees.
When we look at fruit sweetness compared to Nemaguard, our industry standard, we're getting big significant increases in fruit brix under Krymsk one, that the dwarfing rootstock. What's happening, what's the picture look like for September Sun? We haveNemaguard fruit size, that's getting bigger fruit on Alberta, we're getting bigger fruit or cornerstone, and we're getting bigger fruit Cadaman over a 5 year average.
In terms of fruit sweetness, there's not a lot of statistical differences in fruit sweetness among the five root stocks in peach.
Another way we're looking at the data is looking at the distributions of all the fruit that we measure across the rootstock treatments and what we're wondering, whether we can see a shift to the right of the curve. That means we're getting a higher mean value at the same sort of variation, the same sort of uniform. We might also argue that we might get a more uniform outcome, but at the same the same mean value where we get the best of both worlds, where we are shifting the profile of quality and we're getting a higher mean value and more uniform.
So here's some data for the first season of nectarine Rose Bright under the four root stocks in that year. Nemaguard is the purple line here. Cornerstone, and krymsk 86 do look like there's a shift to the right in fruit size. So there's a huge range in fruit size outcomes here, but the distribution of fruit in the fruit size, is suggesting the beginning in that season, a shift.
When we look at, in that same season, Rose bright fruit sweetness, bricks, where you're getting no significant differences between the profiles, the distributions under the different root stocks.
These are a summary from last season, Rose Bright under the five root stocks. Nemaguard*, Elberta, Krymsk86, Cadaman, Cornerstone. We can see in fruit number per tree we're getting small, but smaller trees, the Krymsk, the Krymsk one trees don't have the capacity to carry large fruit number. Hence the yields are low, fruit numbers low. However, their fruit weight in this season was maintained very similar, statistically similar to the Nemaguard. However, they were sweeter fruit but more firmer fruit so less mature, but they had a higher percentage red skin color. So they were sweeter fruit, more red fruit, but the yields were down.
So in summary, what have we found? For tree growth metrics we found in the nectarine, the Krymsk 1 showed dwarfing traits. We saw that in reduced tree size and vegetative growth, whether that was everything from pruning biomass, main branch size, light interception , shoot length. We did see excessive levels of suckers under Krimsk 1. We continue to see that. We did have some suckering on Krymsk 86 as well, and it was greater than the standard Nemaguard. Krmsk 86 also showed some semi dwarfing traits in the light interception data across many years. Alberta and cornerstone had similar growth and development compared to Nemaguard. We've got the summary here for peach, with tree survival in establishment years was lowest under Krymsk 86 and Cadaman. Krymsk 86 did show semi- dwarfing traits. There was some suckering in Krymsk 86. The other three Alberta, Cornerstone and Cadaman had similar tree growth and development. In terms of the yield and fruit quality, the main messages are cornerstone increased average fruit weight, and in color compared to Nemaguard. Krymsk one produced low yields, good fruit size and sweetness and improved color. Yield and quality under Alberta, Krymps 86 were similar to Nemaguard. For peach, Cornerstone and Alberta increased fruit weight and red skin coverage. Krymsk 86 produced similar yield, fruit weight and Brix, however, did have increased red skin coverage. Yield, and quality under Cadaman was similar to Nemaguard.
I've covered that off earlier, so the main conclusions is that we looked, examined our peach and nectarines using dwarf, semi dwarf and high vigour stocks and found that we did induce vigour effects on tree growth, tree development, yield, and fruit quality.
In summary, Cornerstone - high vigour, large sweet fruit, and high yeild.
In summary, Krymsk 86, semi dwarfing,
and Krymsk 1, low yield, dwarfing, and excessive suckering.
Further information: we can refer to the latest issue of the Australian tree crop magazine. Also posted on the www.hin.com.au. We've developed production protocols and a grower information there on the HIN. We've got published scientific literature and summary tables of yield and quality for each experiment on the HIN. You can contact me directly or researchgate. I acknowledge the funding body and the project team members.
Okay. Again, Mark O'Connell here and today, pleasure to present an quick overview of the food agility CRC project, which is based in looking at sensors for summer fruit. It's a two year research project and we have a, quite an ambitious project looking at real-time sensing technologies that will assist growers and exporters to improve their export quality outcomes. It helps us decide on when to pick, orchard management decisions, estimating yeild and looking at fruit quality throughout the value chain. I've got the four sensors being investigated there, pictures down the bottom. So the the spectrometer, the colourmeter, the cartographer, and the biostatic LIDAR. We're involving industry partners and we'll hear from Rubens and Green Atlas today.
So the fluorescents reflectance spectrometer for Rubens technologies is examining firmness, maturity, sweetness, and internal disorders. The kilometer colourmeter, sorry, is Ruben's technology sensor as well. We're looking at color of fruit skin. The cartographer is a mobile sensing platform, Green Atlas, again, looking at fruit number, fruit size, yield and quality and fruit color and the biostatic LiDAR from RMIT university is looking at fruit maturity, and tree photosynthesis. So the work we're doing is to develop these sensors, calibrate these sensors, validate these sensors and evaluate sensors and using the facilities on the Tatura Smart Farm, laboratories at Tatura, in RMIT, and Agribio in our department and also commercial orchards.
The Project team is listed there and we'll hear from two, two of those today, and Agriculture Victoria, Green Atlas and Rubens Technologies. I won't go into this data, but we are looking at, they've done a lot of measurements last season on color, size and fruit quality, the maturity, and more. I'm sure we'll see this graph in the next presentation, this heat map of fruit number, and it's done on a commercial orchard.
Where to next.? So this coming season, we're doing field calibrations, we're doing data analysis, obviously. And then the evaluation and road testing these sensors with commercial orchards.
Hi everyone.
So here, I'm going to present briefly the results of our, the first season that we've done on the Food Agility, CRC project with Ag Vic and Summerfruit Australia. And this was the assessment of the accuracy of the hand-held spectrometer that we developed. The basic idea of this spectrometer is that you've got a single system that can taken in the orchard. So it's a battery operated system. It works over smart phone or a tablet and it can take a scan of a fruit of the tree without picking it. And with a single scan, you get a whole range of parameters that might be of interest. And so what it changes is essentially a calibration model that has happened in the background.
That's how the scanner look like. So this is cover that is flexible. So it can wrap around branches and so on. So we're going to reach the fruit to, to be scanned and, and then scan anything in real time, get the parameters of importance, of interest on your smartphone.
So this spectrometer briefly works in different modalities. And so they are acquired in the same scan. So just by pushing a button, then you'll get all these scans taken. The data is in real time uploaded to servers and through the prediction models down the server, then the the result is returned on a smartphone. What we did the project for the agility this year, the past season was about developing models for firmness and sugars in Brix, and tried to also determine the occurrence of storage disorders in fruit. So there's two different experiments are gonna talk about now.
Okay, so the first one was done within Tatura, and so that's the way of five cultivars that were chosen for the experiment. And in all cases the fruit were scanned with Rubens and then, and then the destructive testing was done on the fruit, and so the conventional measurement of sugar, firmness, and then eventually other parameters like the DA meter, the ethylene was also collected and dry matter and and I believe all the other things like size and so on. So then after this was done, will be developed a machine learning model that takes the, essentially the spectra, that Rubens acquires, and trying to predict the the value that the destructive testing was. And so then we can, with those information we can evaluate what is the accuracy. So for instance, here is an example done on, there's, this is Snow Flame 25 that's white peach. So here on, in these graphs on the X axis, you have the measured quantity done by the destructive testing, and on the Y axis you have what is predicted by the spectrometer. So you would like to have those datas sitting nicely on the 45 degree lines, so that's here. Then there is some scattering around that and that enabled us to evaluate what is the accuracy. And so here we are within five to 10% values the error of the primary data. And then in this case, we did model for all of those things are here to see, for instance, the Brix, firmness and the ethylene. This was done on over 300 skins for cultivar. In this case here, the graph was shown the data we're taking, the scans were done in the lab, but we also tested the scans done in the orchard. So for instance, here, there was this September Sun. These scans here, about 90 scans were taken all in the field with Rubens and then the fruit was picked, then the destructive testing was done after that. And we do not see any decrease in accuracy because of that. And so we wanted to test these things and, to have a good test of the, of work in this scanner in the orchard, and that was important.
And the other experiment that was done was to use this scanner, the Ruben scan to try and predict the occurrence of storage disorders. So this was a bit more complicated. So there was a number of fruit and this scan was done at harvest, then the fruit put in cold storage for a variable number of weeks, and they were also then taken out cold storage and left at room temperature for a variable number of days to simulate retail. And what we try to do is use the scan in all those steps the fruit will scan as well. And at the end, they were visually assessed for any types of internal disorders like browniness, mealiness, rubberiness.
What we found is that if we scan a fruit, we have more than 90% accuracy, we can predict if that fruit at that moment will have a storage disorder. So if we have, for instance, there is browning in there. Now, if we instead of scanning at that moment, we used the scan that we're taking earlier, when the fruit was first taken out of cold storage. So we have the more than 80% accuracy in the occurrence of internal disorders in a few days. So by the time that the fruits, let's say for three days after the removal of cold storage. And then we did the same with the scan at harvest. So what happens in that case? We can use the scan at the moment, which food is harvested, to predict the likelihood of this food displaying some internal disorder in a few weeks time. So after it'd been through cold storage and eventually retail time. And so this was obviously it's done only on a single curly wire. This was the yellow the whole had a yellow peaches.
So it, we probably require s, needs a little bit more validation, but this data is very, it's very promising for what essentially trying to use the scan it to have a prediction in the future of the likelyhood of the quality of this fruit.
Okay. Now the last things I want to say is that all these models were done on individual cultivars. But in some cases it might be easier to actually deal just with genetic models. For instance, here is a yellow nectarine or white peach or something like that rather than having individual cultivar models. So in this case, there were some data from different types of yellow, different cultivars of yellow nectarine, here, listed here and there were taken from different orchards and in different places in this case was Cobram, Shepparton. And and so we can also generate models that are genetic in the sense as you can see there's Brix and firmness for a yellow nectarine model. That's, that's about it. I would like if I have a few more minutes, actually just show a demo file of how the system can work.
I will share my screen where I have, all right. I have here is. Is that visible? That is the screen of my tablet in there. And I have with me, the prototype spectrometer properly visible in this small camera image. I have connected the scanner to my tablet, where there is the app in there that is visible. So that's connected to the device, and then I'll go on a scan tab. In this case, I haven't got a stone fruit, I've got an apple here, so i've selected apple Granny Smith over here. And I can start the scan. The app asked me to put some labeling there. So for instance, I have, we can say it's a block one or something like that, labeled. And then then we scan the apple. If you can see my camera that's how the apple's in the device. And then get the scan in there, now it's been scanned. And it takes a few minutes, now the data has been transferred from the device via Bluetooth through the, through to the app, and through the server. Now the model is analyzing this data and returning a value for, that is probably a bit small, but it's in there, firmness and Brix value. In this case, these are the models that are available for this particular fruit. But then you can, if we have more models, say for instance, you need to have ethylene or you need a DA meter, or need a colour or what not, that can be just listed in there, in one single scan. So that's the idea. So one can repeat the measurement a few times and get a few stats on the same, on a block for instance, and this can be a quick way to estimate the quality of the fruit. And these data is also available on a dashboard or a spreadsheet of scans that have been taken and the values of the firmness and Brix for the various fruits. So that can be easy to export for instance, in Excel or something like that.
So what I'd like to talk about this afternoon is about what we do for the tree fruit industry, how it works and how it can potentially benefit you and really focusing in on what we've been doing as part of the Food Agility Summer Fruit projects.
Okay. So really as a company, we're really trying to focus in on this idea of providing growers with easy to use tools that really help them manage the quality yield outcomes for their orchard. So in the cartoon graphic I've got here, it's really about getting, the right number of quality pieces of fruit on the tree, and not obviously not maxing out what you have. Now, I was thinking about this and it's, it's not too hard to imagine, how you can do this for a single tree, but when you really scale it up to the size of an orchard, it's it's an incredibly challenging problem. How do I make every tree, this magical Goldilocks tree?
Largely at the moment, typically growers are managing this by taking hand measurements, collecting only a tiny amount of data on what you actually have, and then there's an inbuilt assumption that you can extrapolate to the rest of the orchard. However, our experience and what you'll see through this talk is that it's very rarely the case that the orchard is uniformly distributed in any of the metrics that we measure.
So we provide a ground-based platform that collects data on every single tree. Typically, several samples per tree, and we do that at a speed that's really unparalleled anywhere from driving up and down the rows from around 20 to 25 kilometers an hour in say a narrow row spacing all the way up to 40 to 50 kilometers an hour in a wider row spacing.
So really that's what we're trying to do is get through your orchards very quickly and measure everything. And if we do this right and we give growers the right kind of data at the right point in the season, really, we want to be able to empower growers to manage every single tree in the orchard to become this Goldilocks trait.
So there's a lot of benefits that you can potentially get out of precision management. I'm sure I'm preaching to the choir here. Top line we're talking about, revenue increases by having more, high quality fruit. Bottom line really is about just optimizing what you have, whether it's labour, whether it's inputs or other logistics, really just having a much longer range view of what's going to come out of the orchard.
So the cartographer itself, which is the platform we use to gather this data really it's the thing on the back of the ATV. We don't build ATVs. We have a couple of color cameras, very high resolution that we use to take images of the tree. We also have a very high speed multi beam LiDAR that's giving us more than 300,000 laser measurements per second. There's a custom lighting solution, which you'll see in a minute, is very important for us to get very high quality images all day, every day, and at nighttime. Typical operation with the power runs off batteries. We can easily get a good shift in 10 plus hours of a charge. So typically we'd run it during the day, charge it up overnight and we're ready to go the next day.
So it's also engineered to be highly reconfigurable. So we use it in many crops. Think we run commercially in about 16 different crops now. You can see on the right, our system's ready to go for an almond orchard. In the center there, it's completely reconfigured -all the same sensors, all the same processing, but completely reconfigured for kiwifruit where we've got a bottom up looking system.
And it's fast. So it works day or night. You can see on the right-hand side that we've taken a daytime scan of an apple orchard, and we've generated a fruit load map. In terms of repeatability, which was the question asked earlier, the nighttime scan is essentially indistinguishable from the daytime scan. And you can see that in the video. The speed that the system is going right now is very typical in narrow row spacings.
So in terms of the work we've been doing in Summerfruit, it's very much been a close partnership with Green Atlas and Ag Vic. Ag Vic, I'd have to say, has done all the hard work here in terms of running the experiments and validating the cartographer and really keeping us, us honest. So all the results that say, this is how good it is, are all independent validation coming out of Ag Vic. So you can see here a couple of the different experiments. We drive, we have done full commercial orchards, but we also do essentially patch based experiments where we're running the system along zones and really just gathering a lot of information over small areas. But that information is then validated through ground-truthing either hand counts or independent measurements of things like size and color. You can see on the image on the left, there's even some artificial fruit there, which I think are just brightly colored tennis balls. Again, it's all about, ground-truthing the data that we collect. And when we say it does a particular thing to a particular accuracy, having that, that suite of measurements there that says, yes that's actually correct.
So here are some examples that we've done with comparisons to, to caliper measurements in, in fruit sizing. And again, this is data that we're able to collect driving past it, in these orchards probably 20 to 25 kilometers an hour as we drive past. And we're getting very close to ground truth. You can see the the measurement there, the dotted line is one-to-one, what you would get if we were absolutely perfect. The red line is a line of best fit. And the dots are essentially all the samples.
Now that's all the data that we measured. It's also broken down by variety and training and a bunch of other metrics, whether the fruit was measured up high in the canopy, whether it was measured down low in the canopy. And when you get essentially the same results that, for the different cultivars, we essentially get, very good sizing estimates as we drive past. On the different training systems, we're also getting, very good estimates.
Since we got these results, we've actually backed this up with our partners, particularly in the Northern hemisphere in France and in Washington state in the USA in particular. So we now have thousands and thousands of hand measurements that back up these results in other crops particularly in apples.
In terms of color. Again, we get fairly good distribution, fairly good line of best fit in terms of, do we match what an independent measurement of colour says? We would never expect it to be perfect given that we're subject to the, essentially the vagaries of of ambient lights, so we measure, not just the color of the light that we shine on the on the fruit, but there's also the effects of sunlight. Was it a cloudy day or was it a sunny day? So we're actually very pleased with these measurements. I think everything on this graph is taken during the daytime. We would expect the era to diminish at nighttime. And that's a series of experiments that we'll do going into next season is, what the cartographer results will look like when we do nighttime scanning, rather than the daytime scans.
When we put this information together into a map, it looks something like you see on this slide. So you can see there are a couple of commercial blocks of plums and nectarines. I'm sure it's a little bit hard to tell in these figures that the color variation, but I can assure you it is there. And we've actually developed a new tool recently to really highlight the color variation using the hue of the, of the color. But you can see in the bottom, across a number of different fruits, so the left two images in that bottom panel are apples. So three months before harvest, we've got pink ladies that are very green. And then just before harvest, we've got the bulk of them have developed the rosy glow that allows them to be sold as pink ladies, but not all of them have. And you can see there are bands in that image where they're largely still green apples. And then you can see, other results that we've got in commercial orchards, and on ag Vic's experimental properties in plums, nectarines, peaches, pears, and a different variety of plums here on the right. In in some of the summer fruits those colors are very closely related to fruit maturity. So one of the other things that we absolutely plan to look at, which you can only see there in the apples, but really is how those colours track over time, really, so to give growers a better forward estimate in terms of when should they plan to harvest, but also when you look at the variability, which you can absolutely see in those bottom images, should I be doing a variable harvest? So should I havest parts of my block earlier than other parts of the block and that's information that we can absolutely provide by being able to show the geographic distribution.
Now I'm gonna switch to yield estimation. So that's something else that we've done, both on Ag Vic's properties at Tatura, and also in a couple of commercial farms. There's a, I always have this slide to talk about what's different when we do yield estimates. So normally we produce heatmaps and we can do that simply by driving up and down the orchards and we give you a heat map, and the heat maps shows you essentially the relative yield of a block. But what it doesn't do is give you the absolute numbers. And the reason that's true is because any image based system, just like with a human being can only see what it can see. So there is always some amount of fruit that is hidden, either behind leaves or behind other pieces of fruit. And if we want to go from a very precise system to a very accurate system, then we need to have some kind of calibration to take into account that ratio of hidden, hidden divisible. So we can produce calibrated maps at any point during the season, we've done everything from flowers to fruitlets through to mature fruit. But typically mature fruit and yield estimation is really where we see calibration being important. And the way we get the ratio is by doing a small number of very targeted hand counts. We get a graph, something like you see on the right there. And that allows us to then apply that calibration factor to all of our numbers.
And what it gives us is something like this. So this is a commercial orchard October Sun plums. And we've done the calibration through a small number of hand counts. You can see there, we've done it in 6 different zones. So on the graph on the left, you can see each of the data points. That's allowed us to calibrate the numbers that are in the map, on the right, and that's what gives us the panel in the middle that allows us to say, on average, this is your yield per tree. When you hover over the map, you can see, in this area, this is the yield per tree. And you can extrapolate up to the full blocks. Our typical estimates in terms of accuracies across the board in all the fruits that we've been in would be single digit percentages. I think in the commercial orchards that we did, we got 2%, in stone fruit, 2%, 6%. I think the worst might've been 10%. There were some caveats around that one. We've got a fantastic result, came in this morning from the U S and I've just harvested a block that we predicted two weeks ago, and we were one and a half percent out. So typically we're single digit percentages. So we're pretty pleased with how well our prediction estimates work across the board.
So something else we do, this is not really part of the project, but it's nice to show other things that we do with the cartographer. And again, Ag Vic is involved in some gound truthing on some of these measurements as well. But because we carry a LiDAR we can also do estimates of things like canopy volumes, canopy cross-sectional areas, canopy density, and canopy heights. And you can see those are all representative in the kind of cartoon figures that we have on the right of the image. And again, just like the other measures, we have those as layers in our maps. And so you can see what's the variability in terms of canopy area. And in this case, you can see, Northwest corner, there's some large canopy area and that's the example in the top. And you can see distributed everywhere else, average canopy areas and the yellow , the low canopy areas. So an average canopy area is the example on the bottom right. And that gives, that gives people if you like good targets for things like, how should I be calculating spray volumes? Things like, should I be doing targeted, targeted pruning and just some sections of my orchard.
On that last point, here is an example that we did with with farm cloud in the U S . They've taken a canopy map that we produced, turned it into zones, which you can see on the left. Those zones were then used for doing targeted pruning activities, with a view to creating uniformity across the block. Now they didn't perfectly execute the plan, but you can see on the right once they've done the pruning and then we've, rescanned, they've actually got it very close to uniform. So they've done very well just by using that map on the left.
One of the other things that we have moved into as a company using the kind of data that we have both at flower stage and early fruit onset, so primary and secondary thinning in particular, is looking at the use of variable rates spray. So again, we take our maps that we produce to very high resolution and we turn them into zone maps, plug those into a variable rate spray system or variable rate spreader as the case may be, and we've just started executing if you like plans based on that. So we've done trials now with WAATIC. You can see a little panel in the middle bottom, so you know, that screen grab of the, their controller in an tractor is real, that's just the photograph of the system in operation, and it's of this exact, this exact block in the orchard and then we've gone through and sprayed that .In this particular, they scanned at flower stage to get a flower load map, but then they've sprayed at fruit onset to do thinning. Our partners in New Zealand are now taking this same system and they'll be rolling that out commercially over, over the coming season. So they'll have a lot of learnings there I'm sure.
A lot of benefits. Again, I'm sure I'm going to be preaching to the choir on why you would do variable rate, but this is really when the maps that we produce, which is really just data, it's when you're able to action that data and really start to say, I'm targetting individual trees or individual groups of trees and getting the benefits that come from really managing at that precision level. So volume and sprays is a key one. There's significant cost savings just in knowing that there's no tree up high and don't spray it versus, or there's a dead tree and sprayed there, or, don't spray in the in the headlands, and turning off very precisely. But beyond that obviously we want to save costs, particularly when it comes to manual thinning, spraying at the flower stage and trying to get a much more optimal fruit load at the thinning stage so that the thinning crews can spend less time per tree and you get them through much more rapidly. And that's really, if you like the cost savings that that we're trying to target as Green Atlas. Hopefully I have described our mission as a company, it's really a managing orchards at the tree level as best we can and trying to give the best tools possible that we can to assist with that.
I want to quickly show you where you can find a lot of information that's been presented today. And some of the where the locations where that information will be presented, are on the horticulture industry network website. If you're not aware of this, it 's information on newsletters get sent out with links to this particular website. I'll probably show the newsletter as well. So it's Profitable Stone fruit research. The research is under tabs. So production research. So looking at production in your orchard and proving those outcomes in your orchard. We'll jump into Harvest and Post-harvest management where there's information and you'll see Ruben's technologies here, looking at the prototype that has been working on. We'll update that after today. And there's also some work that's happening in the supply chain area as well that we'll be talking about next week. Just back on the production research side of things, we'll go into the rootstocks information that was presented today by Mark, Dr. Mark O'Connell. And it's got things like grower protocols that you can look at and the results that Mark's been showing. It's also the update with what you saw today. And just very quickly, if you want to look at the orchard to see what it looks actually looks and you haven't had chance to be there, this is a virtual tour. I'll be very quick. You can look around the orchard here. So this was back in February, 2020, just before everything went a bit crazy. Looking at peaches, so this is the peach , September Sun. And we can go on and have a look at what the actual tree looks like. So just quickly Cadaman rootstock. This is the profitable stone fruit newsletter, which I hope most of you are receiving. If not information is also sent by Trevor Ranford from Summerfruit Australia.
And last slide, just a quick thank you to all our supporters, people that the businesses that fund this sort of work, and a shout out to Horticulture Innovation Australia. I've been talking with Adrian Englefield just recently. Just asked me to show you who the members are, that you can get in contact with. They're a regional extension team, and you can discuss anything Hort innovation.
- Industry update Trevor Ranford, Summerfruit Australia CEO
Supply chain research:
- Impact of cultivar, step-wise cooling and temperature management on stone fruit quality during export, Glenn Hale, Agriculture Victoria
- Deploying smart trackers to monitor stone fruit exports in real-time, Glenn Hale, Agriculture Victoria
Video transcript: Summerfruit Webinar 2 Supply chain innovation research 1st Sept 2021
Welcome to the second summer fruit industry webinar. I acknowledge the traditional owners of country throughout Victoria and recognize their continuing connection to land, water, and culture. I payment respects to the elders past, present and emerging. My name is Mark Hincksman from Agriculture Victoria. I'm responsible for online extension of the project you'll hear events today.
This week, we take a look at the supply chain innovation research, and if you missed last week's event, there is a video recording of the webinar on production and ag tech research from the Ag Vic smart farm in Tatura.
The research you will hear about today is funded by the Hort Frontiers Asian Markets Fund part of the Hort Frontier Strategic Partnership Initiative developed by Horticulture Innovation with co-investment from many departments and growers.
So our speakers today. We have Trevor Ranford. Our CEO from Summerfruit Australia who will provide a industry update, Summerfruit industry update. Also we have Glen Hale. I just want to say that due to medical reasons John can't be present today. So Glenn Hale is going to present on those topics. Those topics are impacts of cultivar, stepwise cooling and temperature management onstone fruit quality for export, and deploying smart trackers to monitor stone fruit export in real time.
So just at the end of each presentation, if you have any questions, please raise your hand by pressing the hand in the reactions section on your screen, or alternatively, you can write the question in the chat box and I'll read it out on your behalf.
And we do a poll for each of these. It's very important so please fill out the survey before leaving this event today. This provides us with information to improve our webinars and information services.
And just to let you know, all presentations are being recorded and will be made available on the Horticulture Industry Networks website, and links to these presentations will be sent by newsletters, both the Portable Stonefruit newsletter and the one that Trevor sends from Summerfruit Australia. And I'll now hand you over to Trevor Ranford to kick it off.
Good afternoon, everybody. And welcome to this second session on Stonefruit research. As Mark indicated we would normally historically do a roadshow, but because of COVID lockdowns and COVID in general, that hasn't been possible. We've got these two presentations and I'd like to thank Mark and his team for setting the program up and running them over the previous week and this week. And the important aspect that Mark has highlighted is that all of these presentations are being recorded and are available. Many of you were on the session last week, so I'm really not going to go over a lot of the previous slides. What I'd like to do is just touch on a few things because it's far more important that we spend the time looking at the research, but just from the point of view of an uptight from Summerfruit Australia Limited we communicate regularly with our members. We have a whole range of activities across R and D marketing, market access, market intelligence, export opportunities and right through to running R and D activities like a showcase we did in May and these sorts of events.
Just a quick update from the point of view of last year's export summary, we export over 20,000, nearly 21,000 tons. And that given the circumstances of the season and COVID, it was a very good result for the industry. And the last three seasons have been in that area between 21 and 23 and a half thousand tons. We've certainly held our own in that regard. Some of the industry challenges are there on the slide. I'm not going to talk too much about them specifically, but they are the activities that the industry is dealing with on what is a day to day basis. In relation to our research and development, we have a number of projects that we're involved in and this particular project and the supply chain SF17006. What is important to notice is that we've got a number of projects that are funded from additional pools of money and those in Victoria, you may have seen the release by the Minister, I think yesterday, and that highlighted a particular project, which was the MRL toolkit, which is a project been developed and run by Cherry Growers Australia with Table Grapes and Summer fruit, and they will be an announcement on a stonefruit project by the Minister in coming days. From a point of view of project, program up date, over recent times we've updated MRL data, and we have an extensive database and spreadsheet of MRL for Australia, codex and the export countries.
As I said, we're working with the Cherry growers and Table Grapes on another MRL project and the end result, hopefully before the season starts, will be an MRL app for the Stone fruit industry. The industry's appointed a new Trade Development manager, a lady by the name of Olivia Tait, based in Victoria. She's on board and settling in very well.
You might've heard that IFAM , which is the freight assistance mechanism, has been extended by the federal government through to middle of next year, which is very much welcome for the stone fruit industry to assist in exports for the coming season. And the new Ag Visa has been announced and it's due to be in place by September, the end of September, but the reality is it's not going to solve all our problems. It's just another piece of the jigsaw puzzle. As I said, there will be a formal announcement by the Minister on a new stone fruit for market project', which has been funded by the Victorian government and it's a program and a project between Summerfruit Australia and Ag Victoria, so we will make people aware of that going forward. SEDA, which is our Summer fruit Export Development Alliance. So there's been a new structure in place, and a range of working groups covering those sorts of areas. And also SEDA is progressing what's called a Majestic Pearl concept, but it's going to be a new marketing brand specifically focused at this point in China. But hopefully it will expand out from there and you will hear more of that with industry launch in early October.
The registration process for China and Taiwan and Thailand is completed and audits to be done by DAWE. We had a project meeting for one of these projects , 17006. So we're planning how that process will go forward. And the industry's working with AUSTrade to undertake a number of presentations, country presentations, and excuse me, but it's very much about dealing with exotic pests and diseases. Sustainability is the new topic along with climate change, working on benchmarking activities and Biosecurity . So that gives you a brief update on where the industry's activities are.
As Mark has highlighted the presentation from last week is now available in one of those links, and it covers off on a range of other slides that exists within this presentation, but I won't go through at this point in time. So that's just a brief overview of where the industry is at and again thanks to Mark and the team. And we'll now move into the more important aspects and that's discussing and reviewing the R & D work that's going on.
My name's Glen Hale, work for Agriculture Victoria, and I'll be presenting some of the results from the R and D trials that we've been working on the Service Supply Chains for the past few years. I guess I'm the medical sub for John Lopresti today. And I'll be presenting on the impact of cultivar, stepwise cooling and temperature management of stone fruit quality during exports.
I'll just briefly cover some research that we've done on cultivar performance and the potential for storage disorders. Talk about stepwise cooling to reduce some of these storage disorders. The impacts of temperature management during export. We have developed a calculator that can help predict fruit shelf life storage and at the end I'll present something on where we're going from here.
And just like to acknowledge the Ag Vic team at Agribio, John, Janine, Christine and Marty.
So for cultivars that we've been looking at, nectarine ones, early season, mid-season and some late season ones. Cultivars perform differently under different storage conditions, and we've done some storage trials here at two degrees and at eight degrees. And we've got changes in firmness here on the Y axis. And you can see some variations in cultivar performance there with September Bright, minimal changes over roughly three to four weeks storage and then, say for two weeks storage, you can see a bit of a drop off in June Sweet. And then at a higher temperatures, which could be linked to say air freight temperatures, obviously the firmness decreases a lot more due to the high temperature. But you can see once again, September Bright perform reasonably well, and that's after 12 days storage. All these cultivators are harvested at what we call commercial maturity somewhere between five and six and a half for these cultivars that we looked at.
So just as a general rule of thumb, as we go through the season, storage potential generally increases due to reduce softening. And however, there is a increasing susceptibility to some of these storage disorders. In terms of cultivars and types, yellow flesh peach generally stores better than say a white flesh peach and similarly for nectarines, yellow flesh store better than white flesh. However, there's some decreasing susceptibility to storage disorders as we go along this chain. And I guess, it can be linked to genetic differences within fruit types, tree age, and also orchard climate. Yes.
So over the last four years, we have developed this matrix of storage performance that a lot of growers and exporters have appreciated. We have on the left side, the different types of stone fruit, the seasonality, the cultivar names, maximum storage duration based on for sea freight at two degrees. We've included the low, moderate and high risks for storage disorders here and what those limiting factors might be. Most of them are chilling injury. However fruit softening due to reducing firmness is in there as well. And we have, as a guide included maximum harvest maturities based on DA values and also on firmness values I'd just like to highlight Flavoured Pearl here, 0.7 on the DA and 7 kilos for firmness for maximum harvest firmness there. And I'll talk a little bit about that in the next presentation.
So storage disorders are a problem. They do affect eating quality and signs of them include flesh browning, dry or rubbery texture, abnormal or inconsistent ripening and obviously low juice. And it's all highly cultivar dependent. And as far as I know, many cultivars that are susceptible necessarily, sorry, many cultivators, especially the newer ones are susceptible and I guess that's why we've done some of this storage trials to determine which ones are better than others. Most breeding programs, however don't generally test for storage performance or storage disorders.
The standard practice in industry is to cool fruit to as low as possible, close to zero degrees as soon as possible after harvest And I guess to help extend sea freight duration, there's a minimum time for some of these disinfestation protocols of roughly 18 to 21 days at less than three degrees. The cultivars need to store for at least that long. The usual trip from some of the temperature monitoring work that I've been doing could last anywhere between 25 days and up to five weeks just for the sea freight leg. So cultivars need to perform or to store for this kind of period of time, especially for exports.
So we have done some stepwise cooling. We've been monitoring the performance for Majestic Pearl nectarine and Polar Queen peach. We've done some trials on these and this is the protocols that we've been following. So commercial harvest, we've been, this is the commercial harvest here. Early we've been using, generally, we get a mixture of the spread of fruit based on DA value. These ones being early fruit or unripe, majority of the fruit that we've harvested fall into this commercial harvest, and that's the ones we'll be using in these trials .And these riper fruit too soft, for long-term storage or for exports, so we discarded those. We did separate a third of the fruit into different step-wise cooling. So some of the fruit went in immediately cooled down to two degrees straight after harvest. We did cool a third of the fruit down to 12 degrees, and another third of the fruit we cooled down to 18 degrees. We, we did, and we held that at for 48 hours at those temperatures. We separated them into trays, then we assigned, so we've got the three pre-cooling treatments there, and then we assigned these trays into four different cooltrooms for longterm storage. And we removed a portion of the fruit weekly for up to six weeks. And then we did a shelf-life assessments on these straight out of storage and we did ripen some for three days and for five days, and I'll show you some of the results there.
So all fruit was preconditioned down to these three different temperatures within seven hours of harvest. And we did hold them there for two days at those conditions. And all the fruit that we used in these trials were of the same maturity, which was the commercial maturity. And I guess that helps to eliminate any more variables.
So for some of the results for Majestic Pearl, storage for six weeks at two degrees on the left, we have ripening after three days and then ripening after five days at 18 degrees. You can see there's significantly more flesh frowning in the fruit that was cooled down to the lower temperature compared to the higher temperatures at 12 and 18 degrees and slightly more incidents and severity after five days right in there on the right.
So looking at it, scientifically there was no flesh browning we saw in the first three weeks. However we saw we, the initial browning we saw was in the fruit that was cooled down to low temperatures, the commercial fruit after four weeks. And then we've got five weeks here and six weeks flesh browning on the left. We have, the commercial fruit here, and then the next lot here is the 12 degrees and then the 18 degrees. This is straight out of harvest, and then the three and the five days ripening at 18 degrees. And we can see after six weeks storage the fruit that was cooled down to two degrees showed significantly more flesh browning, and the fruit that was cooled down to 12 degrees, and the fruit that was at 18 degrees showed a lot less flesh browning. If we were to implement this step-wise cooling into commercial export conditions for step-wise cooling for 48 hours down to 10 and 18 degrees, you'd cool the fruit down for that long for 48 hours. Then immediately if you're packing it for domestic or for sea freight and then cooling it down and then storing it on pallets before exporting it. If there was a delay in packing and you could potentially follow this line, cooling fruit down to two degrees, storing it and then packing it later on for export. The graph on the right is for air freight. It's not something we would recommend you go out and do straight away. Might be worth trialing on a small consignment and we'll be doing that again next season, similar sort of process, cooling fruit down to 10 or 18 degrees for 48 hours, storing it, and then immediately packing it for export. And then and cooling it down to 10 degrees here. And if you were fumigating it then the fumigation process doesn't have to warm up the fruit as long as if it was cooled down to a lower temperature, like two degrees early on, and then the export process here.
Looking at a stone fruit, temperature management and shelf life predictions. We've developed some models based on temperature and time experiments. We've done extensive air and sea freight simulation trials at Agribio. We;ve done it mainly on unripe and commercially ripe fruit. We've been looking at flush firmness or softening as the quality indicator and these models that we've been developing can be used with real time data, and I'll show you an example of that in a minute. The models do have an accuracy of plus or minus up to three days. And if we've applied them to these exports stages, five of them where we've issued a harvest to freight forwarder, air, or sea freight consignments, importer storage distribution and retailing, and then consumer ripening at say 18 degrees or room temperature. Some of the time and temperature experiments we've done for Majestic Pearl, we've been storing fruit at several different temperatures and you can see flesh firmness here. The decrease in firmness as the temperatures increase and we've stored them, fruit for different periods of time. And this is, we use some of these results in in the calculator just for when there's changes in storage times or temperatures during the export process. We've been able to add these values into that calculator to make it more robust.
I'll just try and use or show you an example of this impact of temperature and storage duration on fruit softening. It's, this one is based for on white flesh nectarine, and I guess typical growers or exporters might have questions, like what is the impact of time and also temperature have on flesh firmness throughout the export process, or what is the impact of high quality during air freight on for quality. And this model has been based on the work that we've done over four and five week storage periods. And it it also assumes that there's no storage disorders or flesh browning, because that can complicate the model a lot more.
Okay. If we're assuming harvest value of eight kilos we'll be able to put in different storage times and we'll see the effect of the temperature has on the firmness here. If I do a airfreight simulation first, say at eight degrees here, I put in say a realistic time of harvest to freight forwarder of say five days, and air freight time of say two days here. Nothing's really changed in the firmness here. I guess because it's early on in the process and the temperatures are relatively low. If say the temperature is a lot more extreme, you'd be seeing a fix here already. And let's assume that the importer stores it for say four days here, we'll see what effect you can see from this decreasing here. And then say three days for retail and distribution, you can see the firmness dropping off here and, and the consumer here, would potentially have the fruit at five, roughly six kilos, firmness. If we assume, if we go and try and do a sea freight simulation. Let's say 24 days for sea freight and see what affected changes to three say two degrees for sea freight. You'll see that there's a small drop off in firmness between the freight forwarders and the importer receiving the fruit. And then the importer was to store for say two days. We'll see what effect that has. The firmness will be roughly four and a half. And then say for distribution retailing if it was, say one day, I'm not sure what's going on there. All right. My refer to John's presentation that we'll have that in a lot better detail than what I've explained it there,
I'll just jumped back into the presentation. I'm just going to the next slide. If the importer was to use this calculator and if they wanted to see how long a shelf life was remaining on the fruit, if they received the fruit at say four kilograms, and we change some of these parameters to say storage temperature three, that's all right. If five days from harvest or freight forwarder, for sea freight, let's say 24 days here. So if we, if we get back here five days storage from harvest or freight forwarder, 24 days for sea freight then the importer would have the fruit at roughly two point the shelf life on the fruit will be roughly 2.6 days.
Some of the outcomes from the research that we've done, the simulation trials can inform a cultivar storage potential under commercial and export conditions.
Step-wise cooling appears to significantly reduce potential for storage disorders. The real impact of quality due to temperature and storage time can be understood using these shelf life and storage models. Good temperature management is obviously always important, but the impacts of temperature on quality depend on cultivar and storage performance.
More temperature work is required from harvest through to freight forwarder and also during the importer storage and at retail to help make these models a bit more robust.
Where to from here. Stone fruit, we have a stonefruit traceability project for the next two years. That's just started. It's funded by Agriculture Victoria. We will do some more commercial testing of the stepwise cooling. So we will be looking for some volunteers for that. Further sea freight simulations that we'll be doing at AgriBio. We following fruit on the tree, prior to harvest and just to see what orchard impacts have on the effect of irrigation and fruit position, what effects they have on storage disorders. We'll also look at the effect of orchard climate and location on these storage disorders. I guess looking at different regions, say between Cobram and Swan Hill and we have some models based on Majestic Pearl and September Bright so far that we'll want to continue to validate and also potentially look at modified atmosphere packaging to extend the storage life for the long sea freight journeys that we're seeing at the moment. And also developing this online dashboard for stone fruit shelf-life models. A lot more information is available on the HIN website. And I know John has recorded this presentation earlier. So I would refer to that for more information.
My next presentation I'd like to present is on deploying smart trackers to monitor stone fruit exports in real time. As Mark's mentioned, it's part of the Serviced Supply Chains project AM15002 and there's a photo of the fruit market in Shanghai early on last year.
For this presentation, I'd like to run through a summary of what we've been doing and then show you some real time loggers, show you a dashboard that Queensland DAF have been developing and we've been trialing. We'll go through some results for both air and sea freight. I'll show you some data updates and alerts from the real-time loggers and some results for the outturn and their retail assessments. Next steps, some more info, and the acknowledgements.
So in the past four years for this project, we've looked at probably over a hundred air and sea freight consignments for stone fruit and table grapes, mainly to Asian countries. And there was a few apples that went to Europe where we were just checking the performance of the dashboard.
We have conducted several out turn and retail assessments, mainly in China, in Shanghai and a couple in gong show as well. And we did another outturn assessment through a third party in Malaysia the middle of this year on table grapes. So the main goals of the service supply chains project is to identify the weak spots as part of this temperature monitoring work help streamline the export process and to ultimately improve the quality and the consistency of the fruit from Victoria.
So the real time log is all talk about today. These ones here, Emerson, Frigga, Sensitech, I've been using. Just started trialing some Tive ones and about to get some Escavox ones. They all have SIM cards in them. So they should be treated alot like a mobile phone in that they do need to connect to the network to get data. I've listed several benefits of using these real time loggers. And the first one here is that they can, they've got sensors in them to monitor location, temperature, and light. Some of them have shock sensors or vibration and it's in real time, provided is connected to a network, so live data. And reports can be visible remotely through these logger dashboards or mobile apps. So basically the data from these loggers is at your fingertips and you can potentially view it anytime on the day or night. Another benefit of these loggers is that if you can set up a temperature and location alerts by email and SMS you can see where the consignments with these loggers are in, or if there's any issues and potentially doing something about it before the consignment reaches the final destination.
Of the loggers that are available, some I think potentially better for land or fore sea or even for air because some of the loggers have flight mode function, obviously for air .There's two types of flight mode functions. One is automatic, the Emerson, and the Emerson logger has a geo fence that's built in to the logger. So when the logger goes through this geo-fence around airports, it will automatically go into flight mode. As a backup, there is an accelerometer in the Emerson and also in the Tive logger so that when the plane takes off the logger will pick up rapid changes in speed and height and automatically go into flight mode. And then obviously when the plane lands, picks up the changes again, and it will disable the flight mode function. There's a manual function on some loggers like this Frigga your one. If you're in their dashboard, if you go to device settings, you can type in where you want flight mode to to be activated. So at Melbourne airport, will automatically put a 5km ring around the airport, so when the logger passes into that zone, it'll go into flight mode. You can set up alerts here. And then the only other thing that you need to do is include the time of the flight that that logger needs to be in flight mode for. So that's a manual version compared to the other loggers that are automatic. These loggers that I'm talking about today are single use loggers. So unlike USB loggers you're not relying on anyone else to collect the loggers and send information back. You have information at your finger tips. So you're not relying on anyone else to collect them. They're relatively cost effective at about $75 each. They do go over a hundred dollars depending on which loggers you have. This ones with probes that can measure say pulp temperature, as well as ambient temperature, or even say on a long cable, you can measure different positions within a sea freight container using the same logger.
And I think another benefit of these real time loggers is that all links will be more accountable because you can set up these alerts and you can see what's happening pretty much all along the export process. Talking of airline approvals, there's three loggers here. The Tive logger has the most approvals, over 50. The Emerson one has approvals for over 30 and the Escavox logger has, relatively new, has approvals for roughly eight. That's not so much the number of airlines that have approval, but it's more about which airlines you would be using for your export of fruit. That is important. The other thing to note with flight mode is the logger's continually recorded during the flight, but they don't actually send the data until they come out of flight mode, so that'd be the other end.
Pretty easy to use or to activate these loggers, the Emerson one, you just pull a white tab out to start it. These other ones have buttons on the front or the back, which you just need to push and hold for a few seconds until you see LEDs flash, and some beeping noises, which indicates that they're active. It's important to start these loggers one to two hours before deploying them in consignments because they do need to connect to the mobile network. And it's also handy to start them in an open area so that they can connect before going into a container or you could potentially run the risk of not getting any information until the container reaches the important overseas. It's important to record the serial number and on this Frigga logger, there is a activation or additional code on the back that needs to be entered into the dashboard for you to access the information. And I guess making a note of where your position, these loggers within a consignment.
Where to place them, the logger companies recommend placing them on top of the last pallet in the truck, or say a sea freight container. That's where signal is best. You can put them in the middle or in other positions but the signal may be compromised. It will still record but you won't get information until the other end, which may be too late. We've been putting the loggers inside the carton at the top here at the back, just to measure the ambient temperatures around the fruit more than what's actually in the container. And I'll show you an example of that later on.
If we look at the dashboard that QDAF has been developing and we've been trialing with these consignments, this past few years. If we log in, this is what you would see. It's a user friendly dashboard compared to some of the other logger ones. It is quite basic, but it will show you the time and the temperatures for your consignments that you've loaded. This is the landing page. We have a dashboard here we've got 40 or 50 loggers that are archived. We can show you how to manage a device and shipments. There is a shelf-life calculator linked on this dashboard, but it's mainly for mangoes at the moment. And I guess we'll be hoping to add stone fruit and potentially other crops in here as well. And then on the left here is the default settings. If we go across here, you can see a consignment ID, what fruit you might have in the consignment, the origin and the destination, which logger. Interesting thing about this dashboard is we have the API for several of these loggers, rather than logging into individual logger dashboards, we can just stream most of them into this one, and it's just a matter of selecting which logger here. He's the logger name and some other information. This is just an example here that I put in yesterday. So there's no records, but we can link QR codes to this logger and to the consignment. So I guess for traceability, that could be quite important.
If we go to manage, in setting up a logger, it's a two-step process and I'll just quickly go through that now. So if we click on manage device here, this is what we would see. If you add lobby here, it'll come up with another screen where you can, you can type in which logger it is, the code, and some other information here, submit, and then that's successful. You can go to, sorry, that should be managed shipment there. And then we go into setting up the logger, add shipment. And then it'll open up another screen where we can input a lot of the information about the logger and the consignment that it's going in. You can type in emails here for notifications. Here's the type of logger again, the code, what position the logger would be placed in a consignment and any other additional information, more specifically for what sort of fruit and the variety, origin, destination. This is just an example, departure date. We're getting in early for this one later in the year. If we scroll down further there's room for more information, then here we can type in temperature alert settings, type in whatever temperatures you want here. And if logger exceeds these, you can get an email. So you can set up location alerts. I'll put this one at say two kilometers, and then it's a matter of where you want these location alerts. So I've just put in the example of this nectarine consignment going into Hong Kong. I'll just type in Coode Island where the ports are in Melbourne. If, which way the sea freight container is going around Australia, you can, if it's stopping at Brisbane, you can put a, an alert there, and I've put an alert here for when it arrives in Hong Kong and you can see it here. And then it's got the two Km radius around there. And my tip is to just add an extra final location that the logger won't go to so that it doesn't automatically stop when it gets to the destination that you actually want it to go to. And then if you hit submit here, you're successful and then it'll come up on the dashboard with the consignment that you'll be monitoring.
If we go back to the dashboard and we look at say a real example of one that would done earlier in the year, I think we'll look at this one here. Number 24, and this is what we would see on the dashboard. So you've got some shipment details here with the logger information, the position, the status of when it arrived or when it left a certain location. You would see a temperature graph here. The red lines are the thresholds that we've set. If you were to hover over any part of the graph you'll see the logger number and also the date, the time and the temperature. I've added just these locations in here just for ease of use. And then down the left hand side, you've got a shipment summary of when it started, where it was last logged, roughly the time that the trip took and certain parameters for temperatures down the left here. And then you can see a map of where it actually went. And these green dots would be updates of where the logger connected to mobile networks.
Looking at a delayed cooling trial. This one's on a table grapes that we did earlier in the year, but I thought it'd just be interesting to look at this logger. We used the one with the probe on it. So we had an approach. We had the logger inside the carton and the probe outside the carton in a sea freight consignment. The graph here at the top and the bottom and the map on the right is what you would see on the dashboard of these loggers. And then these two orange images down the bottom here on the right is what you would see, the same information that what you would see on a mobile app. The red line is the temperature thresholds. And you can see this, one's taken roughly 35 days to go from Mildura to a KL in Malaysia. And you can see some nice updates here on the map around the coast of Western Australia and then through Indonesia and up to Singapore and Malaysia. The top graph view is if you click on this icon, the second graph is if, this graph here is if you click on that one. This was the logger in the carton, so you can see it's nice and smooth. This is a probe that was outside the carton, and I guess it's picking up air movement within the sea freight container. And it's just interesting to see that it fluctuates obviously a lot more than what's inside the carton. With the app, it's to S to see the data, you have to click on all and then toggle these little buttons on, to be able to see it on the app. Very quick information readily available.
He's two on air freight consignment, another table grape ones that I've just put in here. It was irradiated at Steritech. It was just an initial trial after Vietnam approved the radiation for grapes. You can see majority of the time the fruit was kept at the freight forwarder, I guess they had some issues with flights. So the truck that up to Sydney here, and then it's relatively staight to Hanoi in Vietnam. And it's not uncommon for the air freight temperatures to increased to above 10 degrees, and I've seen that in other fruits like cherries as well.
Talking about updates of these loggers. I mentioned that the signal may be compromised depending on where the loggers are. This one's updated a couple of times around the coast and then there's been no updates until the logger's got to Singapore and then headed up to Thailand. This one I think was grape consignment that went to Thailand. I have to double check that, but yeah, there's no updates in the middle section here.
In this slide here is another one showing lots of good updates around the coast. I guess it depends where the container is on the ship. Potentially if it's on the near side to land, well then there's more chance that it'll update to the mobile towers as it goes around. It's had some good updates through Malaysia through Singapore through the Suez Canal. This was an actual apple consignment that went to, what was heading for the UK. Here past Greece and the actual logger has run out of battery here in Italy. And that was after 49 days. So unfortunately the exporter forgot tell me that it was in the consignment and I wasn't able to change the settings on when the logger recorded or when it reported data. Like a mobile phone they've got the battery life is limited until it needs to be charging or you can extend that battery life by just reducing the frequency of updates and recordings. Interestingly this consignment spent 10 plus days in Singapore. There's been some slight temperature spikes there. Just one benefit of using these real-time loggers, I guess.
There's another consignment that was heading off to Europe last year. The ship was docked at Fremantle. I received an alert for temperature increasing. I contacted the exporter who then contacted the shipping company who then went and had a look at the container and sorted out the issue. And then you can see the temperatures decreasing back down here. So that was a good outcome or else who knows what condition this fruit would have been if it had to spend another four weeks on its journey to the UK.
Just looking at an outturn assessment that was conducted in Shanghai last year. I put the logger in at the freight forwarder here. The couple of the loggers, got a probe in this one that measured pulp temperature, conducted an initial quality assessment. Here is the fruit being unloaded in Shanghai. And then there's the fruit there that I took back to the hotel room to do a rippening trial on. If we look at some of the data from that here we have fruit firmness, which is the blue bars. If I just highlight this here, this was the initial firmness, which was seven and a half kilos. It was 0.74 on the DA meter which I mentioned earlier in the storage performance of those cultivars. Not much change in firmness between the initial and these two freight journeys. This is where I collected the fruit, and then I ripened it in my hotel for several days at roughly 18 degrees. And you can see the firmness doesn't really decrease at all. And I think it's because the initial firmness was pretty high plus also the time of the journey and this period for shelf life trial is really pushing their life at the stone fruit. It just shows that there's inconsistencies in ripening and also the quality potentially if it's harvested a little bit high and also the length of the journey. The eating quality here in the yellow too, we've got here, one is very poor, three average, five is very good. So ideally you would like to see this yellow line increasing. Unfortunately, on this occasion it wasn't, and that's just to do with the inconsistent ripening of this nectarine on this, just in this example.
Whilst in Shanghai, I purchased some other stone fruit from retail. And just like to show the variability in the quality that is available overseas. Probably not the same cultivar, but similar nectarines for different retail outlets. A big variation in fruit weight and also in the sugars, and if we look at the firmness here you can see these fruit here at relatively high, high firmness. And this one here is a lower firmness. Just keep in mind consumers like fruit quality to be around the one and a half to two and a half kilos firmness. And when I tasted the fruit, because this one was a little bit lower in a firmness, it tasted the best and it also had higher sugars. Whereas these other fruits were high in firmness and low in sugars, so it didn't taste very nice. That's just my palette, maybe different to what Asians prefer.
Where to from here, continue some temperature monitoring work on the farm looking at trying to get some more data between harvest and packing and also at the other end for importer to retail and that'll help make some of those shelf life predictors a bit more robust, and also develop a list, we're trying to develop a list of independent surveyors. Andrew Macnish from QDAF's looking at this based on what we're seeing in the markets and exports. It's a little bit uncertain. So potentially we can use these surveyors to assess the quality of fruit that's arriving in these markets. Obviously we can't travel there to see it ourselves. Streamlining the export supply chain, trying to reduce the time that it's taking for some of the fruit to arrive in markets will help with the quality. Also looking at harvest maturities and preconditioning to reduce the storage disorders and to increase the shelf life. And I know there's a few logger companies that are working with shipping lines to tap into their satellites so that when these real-time loggers can't access mobile networks, they could still send information to users. So that will be quite handy to be able to attract temperatures for the entire journey. And we're also developing the dashboard and tweaking the shelf-life predictor for stone fruit, and potentially for other crops like table grapes as well. More information. There's a few industry articles out there in The Vine and also Across Borders. And there's a lot more information on the HIN website that Mark has already mentioned. And then I think that's about it. I'd just like to acknowledge these funders and other participants as well.
Proposed 2019 - 2022 events (topics & dates):
| Date | Research Topics | Location | |
|---|---|---|---|
| Autumn / Winter 2022 | Grower production protocols:
| Online - Nationally (SAL AGM) and Tasmania (FGT). Face-to-face events: SAL export events (Swan Hill, Cobram, Shepparton), SAL AGM National presentation at the Summerfruit Australia industry export sessions: video presentation May 2022 | |
| 25 | August 2021 | Industry update Production research: Rootstocks on peach and nectarine. Results from SF17006 project, Experimental Stonefruit Orchard Ag Tech research: Overview of the Ag Tech research projects,
| Webinar 1: Production and Ag Tech research Date: Wednesday 25 August 2021 YouTube |
| 1 | September 2021 | Industry update – Trevor Ranford, Summerfruit Australia CEO Export Research Supply Chain Innovation – ‘Impact of cultivar, step-wise cooling and temperature management on stone fruit quality during export’, John Lopresti, Agriculture Victoria Supply Chain Innovation – ‘Deploying smart trackers to monitor stone fruit exports in real-time’, Glenn Hale ,Agriculture Victoria | Webinar 2: Supply Chain Innovation Date: Wednesday 1 September 2021 Time: 4 - 5 pm Vic, NSW, Qld; 3.30 - 4.30pm SA; 2 - 3pm WA |
| August - September 2020 | Summerfruit Industry Webinars: Managing Fruit Quality for export. Four online events for producers and exporters:contains the latest research on supply chain innovation from Agriculture Victoria and the Department of Agriculture and Fisheries Queensland. The aim of this research is to increase the value and profitability of Australian horticultural exports by improving the ‘freshness, consistency and reputation’ of Australia’s horticulture exports into Asia. |
Stone fruit cultivar performance during cool storage and predicting quality during exportJohn Lopresti, Researcher, Agriculture Victoria
Using real-time data loggers and dashboardsGlenn Hale, Researcher, Agriculture Victoria
Delayed cooling after harvest reduces storage disorders in white nectarine and peachJohn Lopresti, Researcher, Agriculture Victoria
Are the fruit on your trees really ready to pick?Christine Frisina, Researcher, Agriculture Victoria (40 min, 29 sec) or YouTube | |
| 13 | August 2019 |
| 13th August: Renmark - Renmark Hotel 14th August: Swan Hill - Murray Downs Golf & Country Club, Murray Downs, NSW 15th August: Cobram - Grand Central Hotel, 36 Punt Road, Cobram, VIC |
Research from Previous Roadshows:
Stonefruit Research Roadshow August 2019
Stonefruit Research Roadshow August 2017
Related research
-
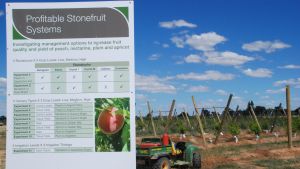 Stonefruit research orchard & equipment
-
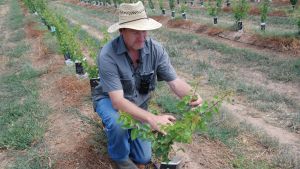 Stonefruit rootstock experiments
-
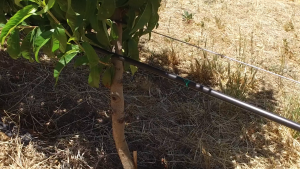 Stonefruit irrigation experiments
-
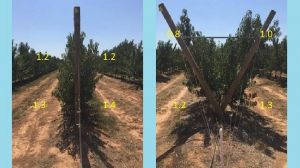 Stonefruit canopy & crop load experiments
-
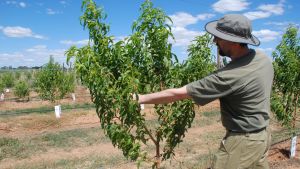 Peach & Nectarine canopies for mechanical pruning & harvesting
-
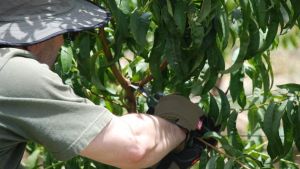 Some stonefruit pruning techniques
-
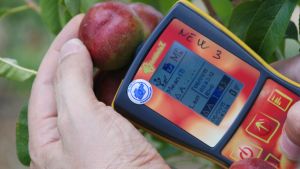 Stonefruit maturity & fruit quality
-
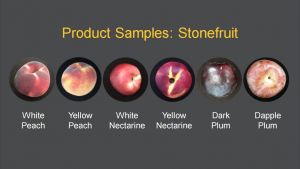 Stonefruit export market research