Testing new sensor technologies to improve cherry quality and consistency in export markets
Agriculture Victoria recently tested a new portable handheld infrared meter (Atago PAL-HIKARi 16) that non-destructively measures sugar levels in fresh cherries. Comparisons were made with a refractometer (Atago PAL-1) that requires destruction of the fruit to obtain a juice sample. Laboratory results showed that the infrared HIKARi 16 was reasonably accurate and has the potential to replace a refractometer.
Sugar levels in cherries are traditionally measured as soluble solids concentration (SSC) using a refractometer and expressed as °Brix (where 1 °Brix = 1 g sucrose per 100 g juice). Modern refractometers are digital, but they still require a juice sample to measure the SSC. The infrared HIKARi 16 was designed to provide several practical advantages over the refractometer.
Measurements are rapid, fruit remains intact avoiding messy juice sampling, and the activation button is easy to access when taking measurement of cherries attached to the tree and in the packhouse. The HIKARi 16 works best when the fruit and instrument are both at ambient temperatures, the surface of the fruit is dry, clean and free from blemishes or bruises.
Method
To test the infrared HIKARi 16, six batches of fresh cherries were sourced from a local retail supermarket and directly from growers in Victoria. Three SSC measurements were taken on opposite cheeks on 20 to 25 cherries per batch, firstly with the non-destructive infrared meter (Atago PAL-HIKARi 16; Figure 1A) and then on juice samples with a refractometer (Atago PAL-1; Figure 1B) and the average SSC calculated.
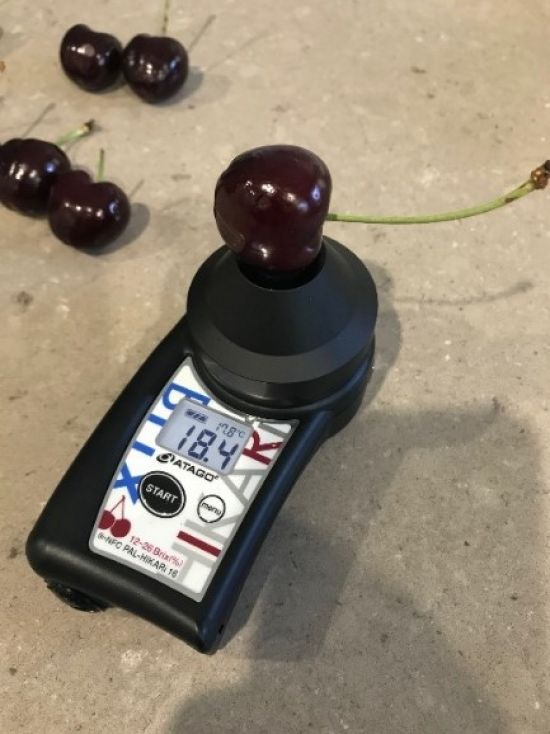 Atago PAL-HIKARi 16
Figure 1 (A). Atago pocket instruments used to measure soluble solids concentration in fresh
cherries - non-destructively by infrared.
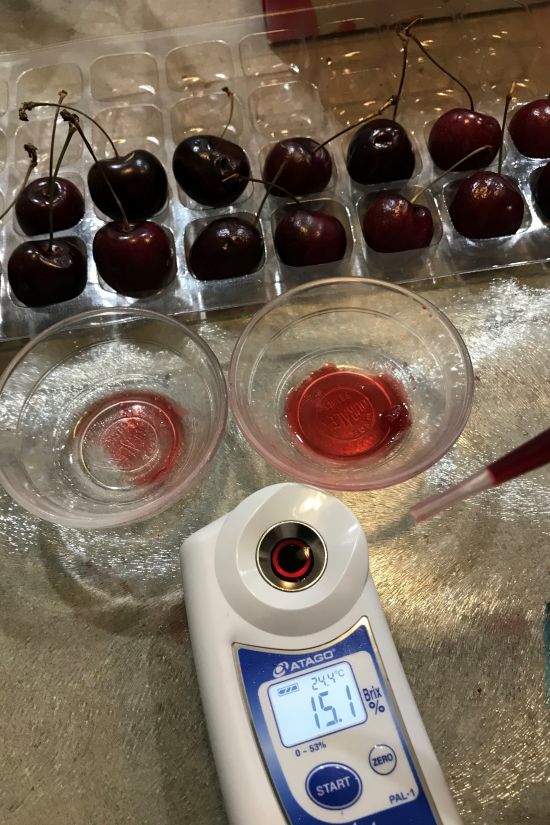 Atago PAL-1 refractometer
Figure 1 (B). Atago pocket instruments used to measure soluble solids concentration in fresh
cherries - destructively on juice by refractometry.
Results and discussion
In general, both instruments successfully measured SSC in fresh cherries with values ranging between 11 and 28 °Brix (Table 1, Figure 2). Differences in average SSC between the two meters for each batch of fruit was inconsistent. For example, in batch 2 the average SSC measured by the infrared HIKARi 16 was 0.8 °Brix less than the refractometer whereas in batch 6 the average SSC measured by the infrared HIKARi 16 was 2.2 °Brix higher than the refractometer.
To account for these differences, the infrared HIKARi 16 includes an "offset" function to adjust values that are under or over the values obtained with a refractometer. Offset values for each of the six batches of cherries that were measured in this study are reported in Table 1.
Another interesting feature is the data transmission function which allows up to 100 SSC measurements to be electronically downloaded to a smart phone by Near Field Communication (NFC). Data can be accessed by hovering any Android or Apple phone (with the appropriate NFC app installed) closely above the meter and exporting the data to Microsoft Excel. This technology speeds up data capture because individual measurements do not have to be manually recorded; however, sample batches need to be carefully recorded to avoid any confusion or misinterpretation of the data.
Field and laboratory testing on cherry cultivars will be undertaken next season to determine if similar results are achievable, especially on fruit still attached to the tree, and to understand if cultivar, maturity or skin colour has any influence on the infrared technology.
Table 1. Measurement of soluble solids concentration (SSC) in fresh cherries using the non-destructive infrared meter (PAL-HIKARi 16) and a destructive refractometer (PAL-1). Cherry batches were sourced directly from growers and a supermarket. SD is the standard deviation of the measured mean SSC within each batch.
Batch No. | 1 | 2 | 3 | 4 | 5 | 6 |
|---|---|---|---|---|---|---|
Sample size | 50 | 40 | 50 | 50 | 50 | 50 |
PAL-HIKARi 16: SSC (°Brix) ± SD | 16.2 ± 0.12 | 16.1 ± 0.19 | 14.9 ± 0.11 | 17.3 ± 0.18 | 22.5 ± 0.18 | 20.1 ± 0.18 |
PAL-1: SSC (°Brix) ± SD | 18.0 ± 0.32 | 16.9 ± 0.23 | 16.1 ± 0.13 | 17.0 ± 0.10 | 21.2 ± 0.23 | 17.9 ± 0.09 |
Offset value | +1.8 | +0.8 | +1.2 | -0.3 | -1.3 | -2.2 |
Linear correlation between SSC measured by the two meters (r2) | 0.82 | 0.61 | 0.40 | 0.50 | 0.85 | 0.76 |
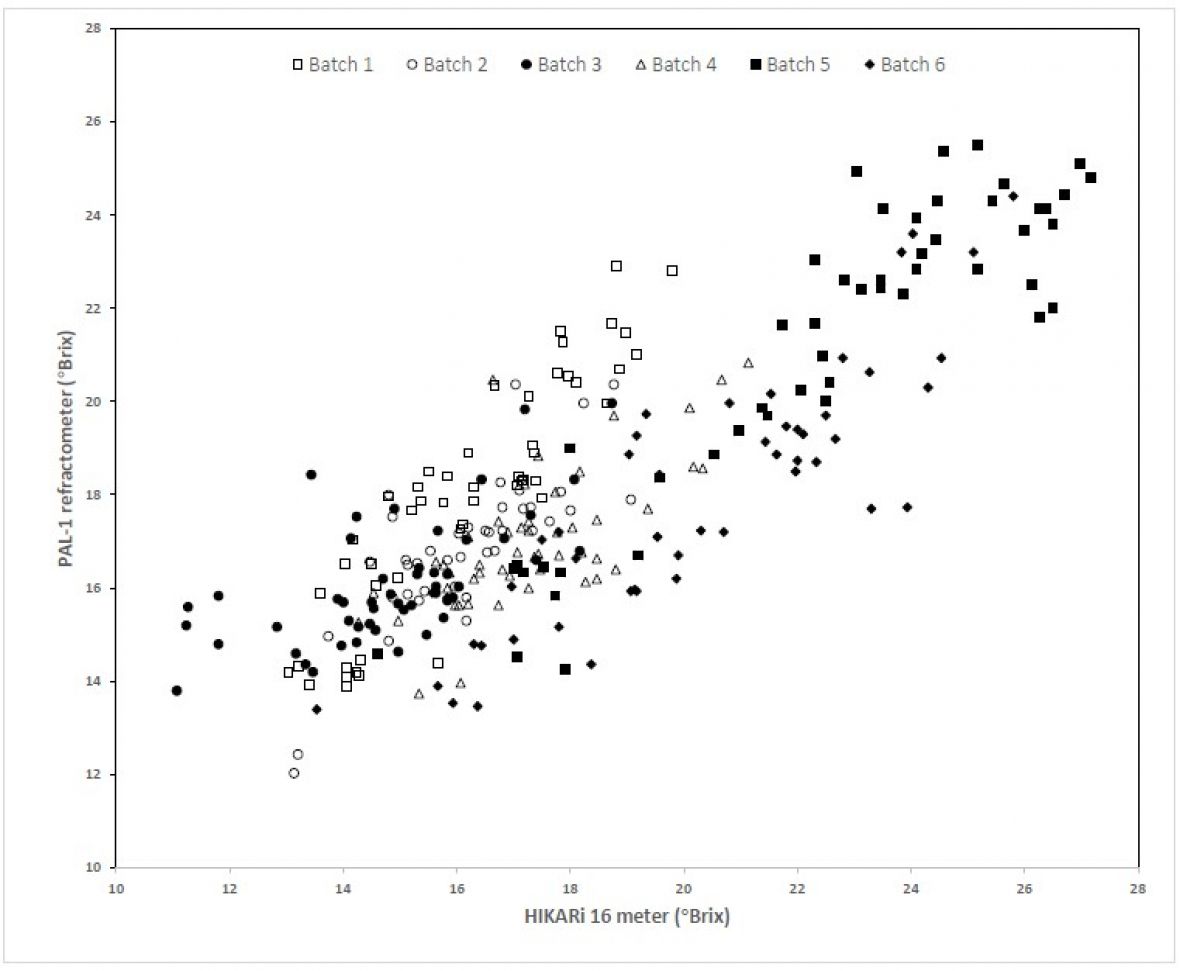
Figure 2. Relationship between soluble solids concentration (SSC) as measured by an infrared meter (PAL-HIKARi 16) and by a digital refractometer (PAL-1) in six batches of fresh cherries.
For more information, please contact: Glenn Hale
Acknowledgment
Agriculture Victoria has a cool chain monitoring and traceability project that is funded by Agriculture Policy’s - Export Development Investment Strategy (EDIS) group and is working with Cherry Growers Australia (CGA) to test new sensor technologies that will help improve fruit quality and consistency of fresh cherries in export markets.
This project is funded by Agriculture Policy’s Export Development and Investment Strategy through the Growing Food and Fibre Markets program.
Department of Jobs, Precincts and Regions, 1 Spring Street Melbourne Victoria 3000
Telephone (03) 9651 9999
© Copyright State of Victoria, Department of Jobs, Precincts and Regions 2021
Except for any logos, emblems, trademarks, artwork and photography this document is made available under the terms of the Creative Commons Attribution 3.0 Australia license. This document is also available in an accessible format at economicdevelopment.vic.gov.au